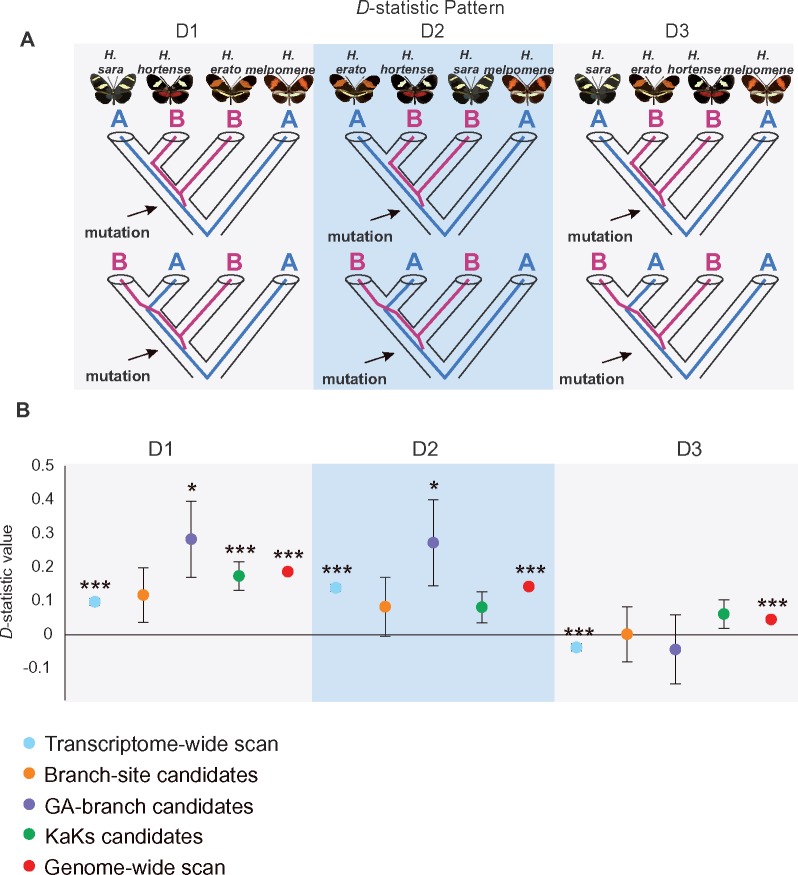
Fig. 2.
—Patterson’s D-statistic patterns among three Heliconius species. We calculated D-statistic values for each of the three topologies shown above (A). The elevated values yielded from D1 and D2 of the transcriptome-wide scan, Branch-site candidates listed in supplementary table S9, Supplementary Material online, GA-branch candidates listed in supplementary table S10, Supplementary Material online, KaKs candidates listed in supplementary table S6, Supplementary Material online, and the genome-wide scan indicate putative introgression patterns between H. hortense and H. sara and between H. hortense and H. erato (B). *P value <0.05; **P value <0.01; ***P value <0.001.

