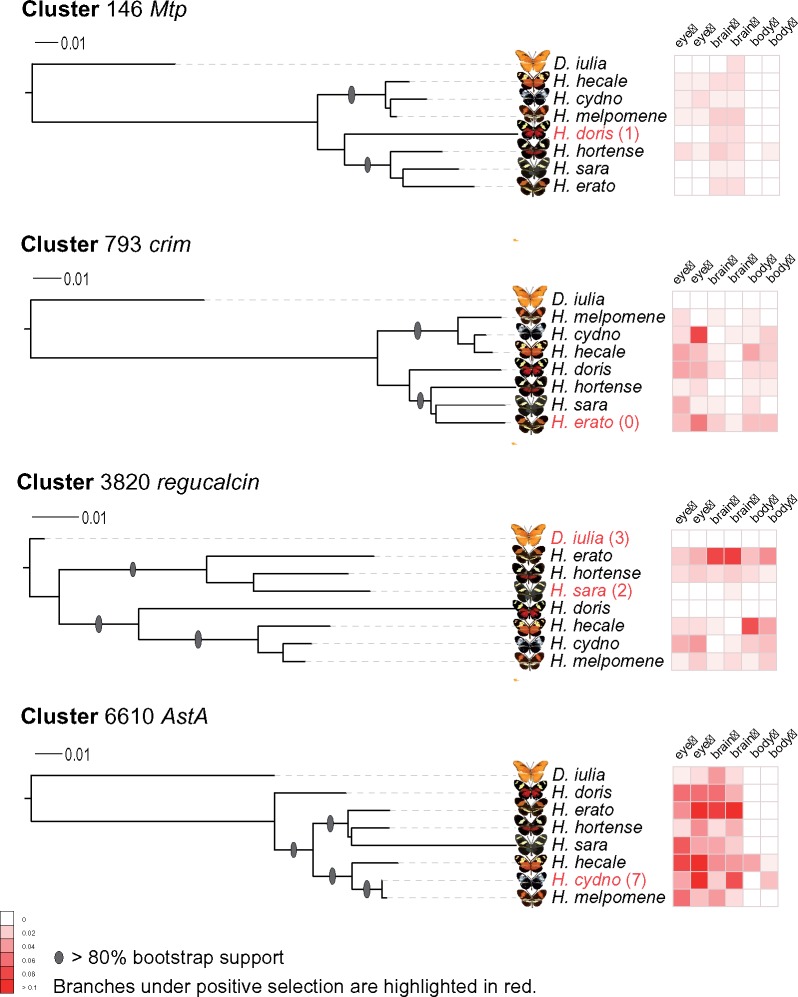
Fig. 4.
—Tissue- and sex-specific expression of four genes in eight butterfly species. For each gene, we construct a maximum likelihood phylogeny based on its conserved cluster, and the scale bar represents the percentage of substitutions per site. The branches highlighted in red, if any, indicate a significant pattern of positive selection, and the numbers in brackets are significant sites identified using CodeML branch-site model. Each heat map grid stands for relative expression base on a normalized gender- and tissue-specific qRT-PCR result with n = 3.

