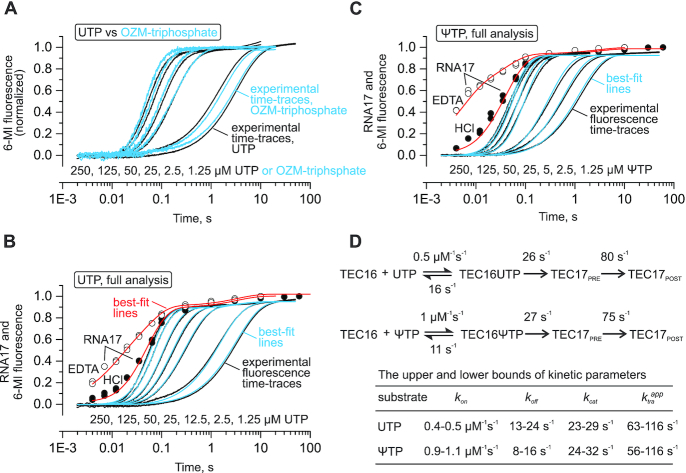
Figure 4.
A comparison of UTP, OZM triphosphate and ΨTP as Eco RNAP substrates. The experiments were performed using the nucleic acid scaffold presented in Figure 3. (A) Time-resolved measurements of the increase in the 6-MI fluorescence upon incorporation of the uridine (back) and OZM (blue). (B and C) Complete quantitative dissection of the uridine (B) and the Ψ (C) incorporation kinetics by the combined analysis of the 6-MI fluorescence and the RNA extension data. Individual time-points show RNA extension at 200 μM UTP or ΨTP in the quench flow experiments with EDTA (open circles) or HCl (closed circles) as quenchers. Black time-traces show the increase in 6-MI fluorescence in a stopped flow experiments at decreasing UTP or ΨTP concentrations indicated below the curves. The experiments were performed in duplicate, fluorescence curves are averages of three to seven time traces. Best-fit lines for quench flow (red) and stopped flow (blue) experiments were simulated using the scheme and parameters presented in (D). (D) The kinetic schemes used for global analyses of the uridine and Ψ incorporation data. The best-fit values of the reaction rates are indicated for each transition. The upper and the lower bounds of the reaction rates calculated at a 10% increase in Chi2 over the minimal value using the FitSpace routine of the KinTek Explorer software are presented in the table below the schemes. The translocation was modeled as an irreversible process and the inferred rate constants (ktraapp) are the sums of the forward and backward translocation rates.

