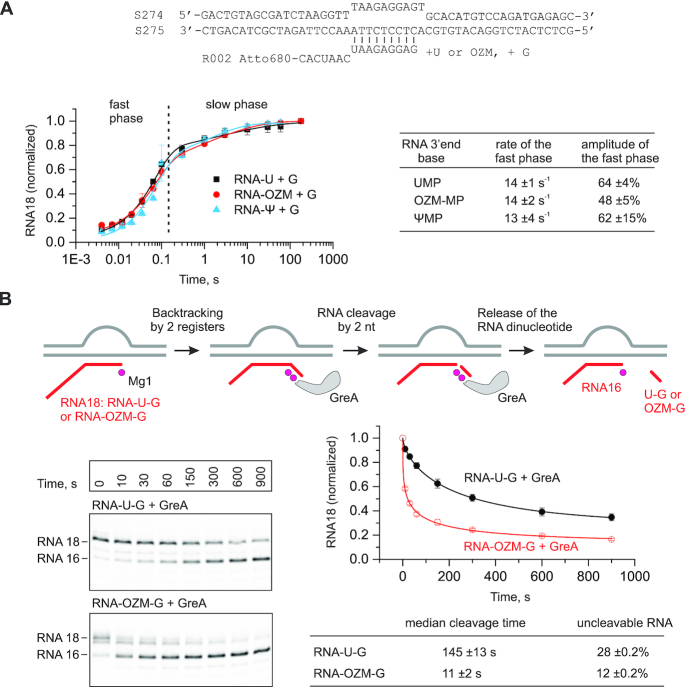
Figure 5.
The effect of the OZM at the RNA 3′ end on the kinetics of the incorporation of the next nucleotide (A) and the GreA mediated RNA cleavage of the resulting TEC (B). (A) TECs were pre-extended by the addition of 10 μM UTP (black), OZM triphosphate (red) or ΨTP (blue) and supplemented with 200 μM GTP in quench flow experiments. Error bars are ranges of duplicate measurements and the solid lines are the best-fits to a sum of exponential (corresponds to the fast phase) and stretched exponential (corresponds to the slow phase) functions. The rates and the amplitudes of the fast phase inferred from the data in the graph are presented in the table on the right. The TEC schematic is presented above the graph. (B) TECs were assembled as in (A) and pre-extended with uridine and guanosine or OZM and guanosine by the addition of 10 μM of the corresponding NTPs, gel filtrated and supplemented with 2 μM of GreA. Error bars are ranges of duplicate measurements and the solid lines are the best-fits to a stretched exponential function. The median cleavage times and the fractions of RNA resistant to GreA-mediated cleavage inferred from the data are presented in the table below the graph.

