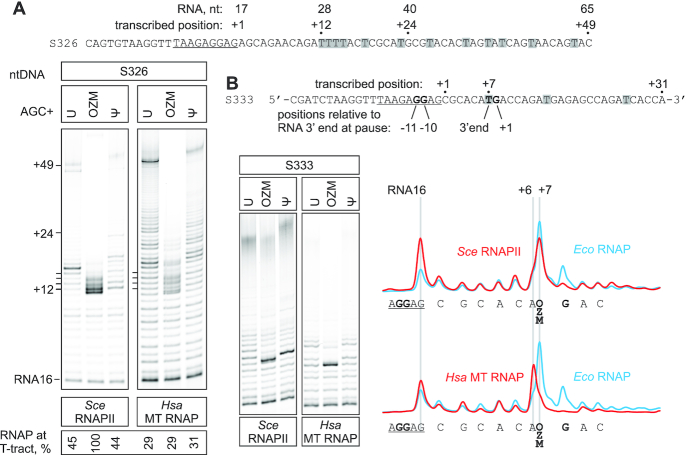
Figure 8.
The effect of OZM on processive transcription by Sce RNAPII and Hsa MT RNAP. TECs were assembled using the scaffolds shown above the gel panels (only the non-template DNA strands are shown) and chased with 100 μM ATP, CTP, GTP and UTP or OZM triphosphate or ΨTP, for 5 min at 25°C. The sequences corresponding to the annealing region of the RNA primer are underlined. Thymidines in the transcribed region are highlighted. Pixel counts were linearly scaled to span the full 8-bit grayscale range within each gel panel. Each assay was performed in triplicate. (A) Transcription through the four-thymidine tract. (B) Transcription through the OZM-responsive arrest site. OZM lane traces are shown to the right, the Eco RNAP trace was quantified from the gel in Figure 6B.

