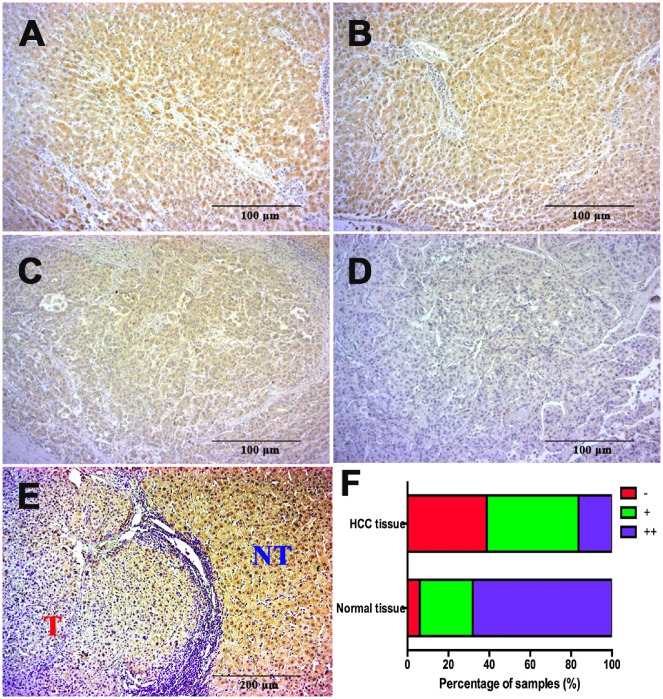
Figure 2.
ApoF protein expression is abnormally reduced in HCC tissues (magnification, ×100). (A) and (B) Representative photographs of strongly positive (++) staining for ApoF protein in normal liver tissue. (C) and (D) Representative photographs of weakly positive (+, (C)) and negative (−, (D)) staining for ApoF protein in HCC tissue. (E) Representative contrast between a tumorous area (‘T’) and an adjacent non-tumorous area (‘NT’). (F) Distributions of ApoF staining grades (−, +, and ++) in normal liver tissue and HCC tissue. Bars = 100 μm.

