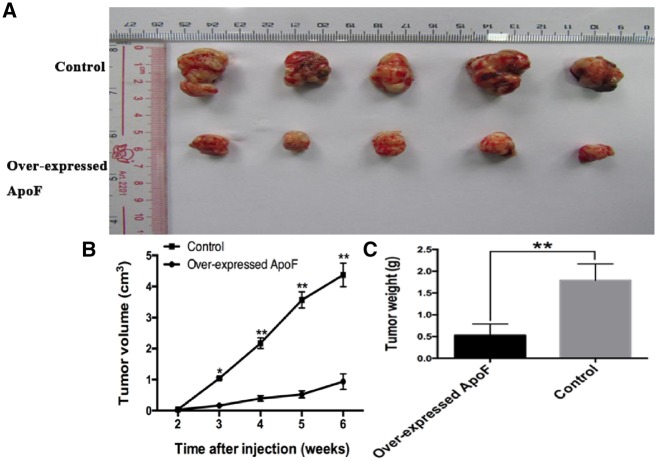
Figure 5.
Overexpression of ApoF-controlled tumor growth. (A) Tumors were harvested at 6 weeks and the tumor size was reported. (B) Tumor volume was calculated every week after injection. (C) Tumor weight was calculated after sacrificing the mice. The data indicate that the xenograft tumors grew larger and faster in the control group than in the ApoF-overexpressing group.

