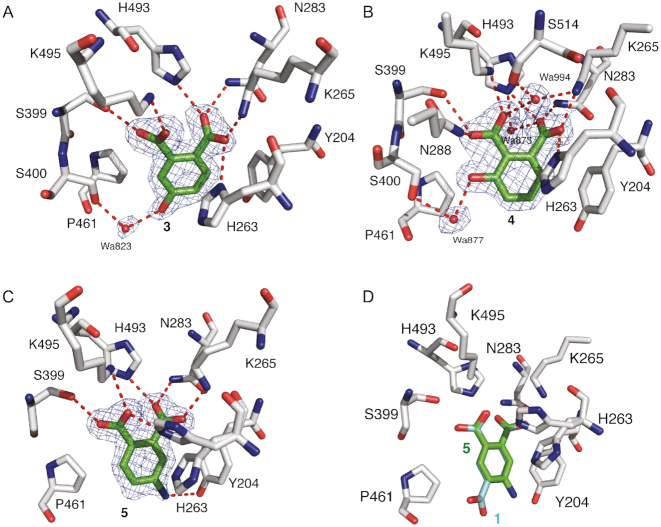
Figure 6.
(A) Structure of TDP1 complexed with compound 3, (TDP1 carbon atoms in gray, fragment carbons in green, oxygen atoms in red and nitrogen atoms in blue, PDB code: 6DIH). Hydrogen bond atoms are shown as red dashes. The fit of 3 to the 2Fo-Fc electron density map (blue, 1.78 resolution, 1.0σ level contour) is shown. (B) Structure of TDP1 bound to compound 4 (PDB code: 6DJI). The fit of 4 to the 2Fo-Fc electron density map (blue, 1.75 Å resolution, 1.0σ level contour) is shown. (C) Structure of TDP1 bound to compound 5 at 1.74 Å (PDB code: 6DJJ). The fit of 5 to the 2Fo-Fc electron density map (blue, 1.0σ level contour) is highlighted. (D) Comparison of the binding modes of compound 1 (carbon atom in cyan) and compound 5 (carbon atoms in green).

