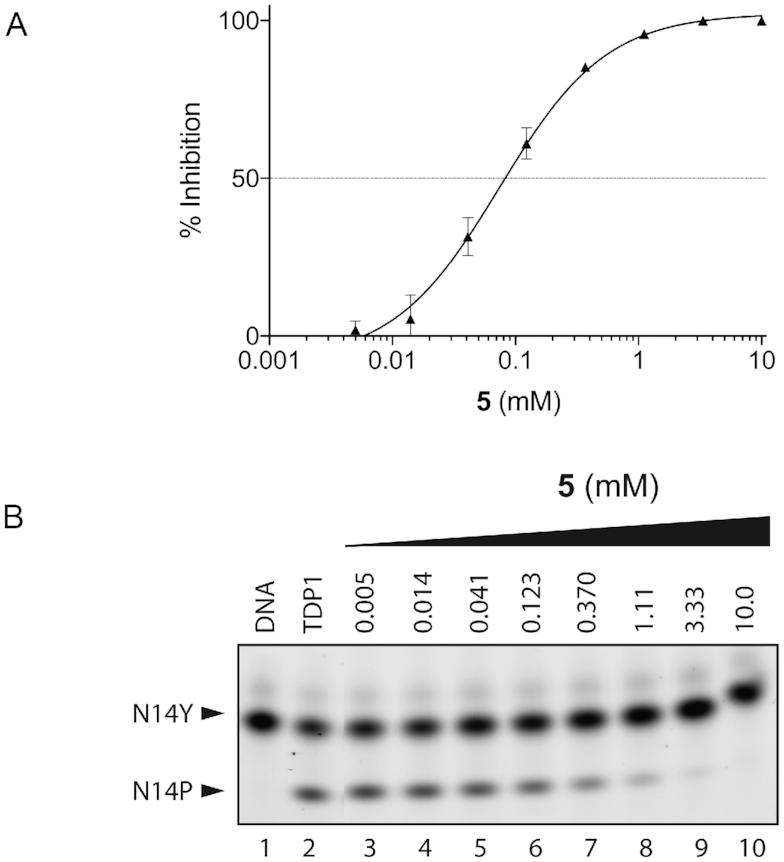
Figure 7.

Inhibition of TDP1 by 4-aminonapthoic acid (5). (A) TDP1 inhibition dose response curve (n = 3, error bar not shown for data points where the bar is shorter than the height of the symbol). (B) Representative gel for inhibition of TDP1-catalyzed hydrolysis by 5: lane 1, N14Y only; lane 2, N14Y and TDP1; lanes 3–10 3-fold serial dilution of 5 from 10 mM to 5 μM.
