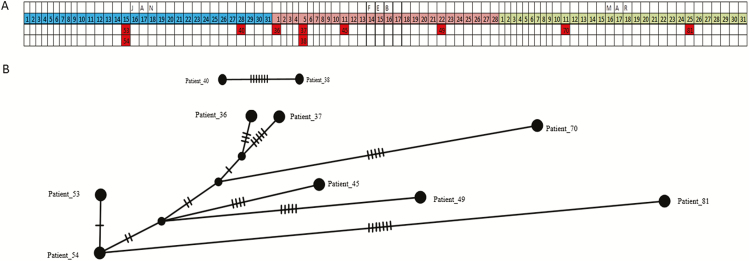
Figure 4.
A, Table with dates of sampling for patients indirectly linked to cluster 2. B, Popart analysis of putative transmission chain of patients using a median joining network. Nodes with no labels are inferred nodes. The notches on each link between 2 nodes represent the number of changes between the 2 nodes at the whole-genome level.

