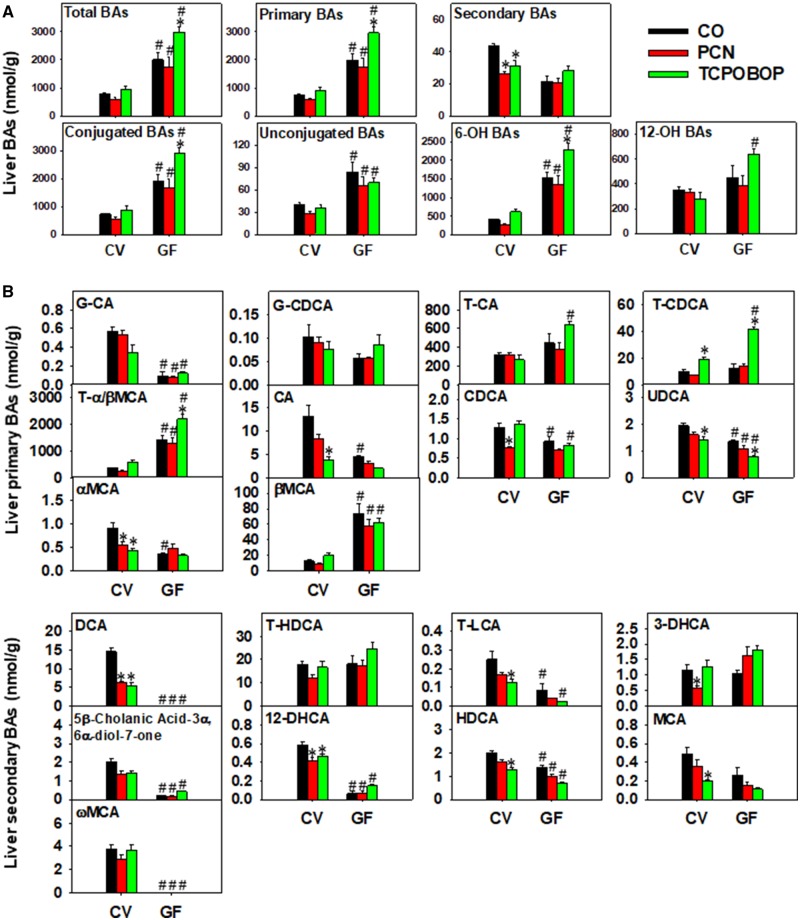
Figure 3.
A, LC-MS quantification of total BAs, primary BAs, secondary BAs, conjugated BAs, unconjugated BAs, 6-OH BAs, and 12-OH BAs in livers of CV and GF mice exposed to corn oil, PCN, or TCPOBOP (n = 4–5 per group) as described in the Materials and Methods section. B, Individual differentially regulated primary BAs (top panels) and secondary BAs (bottom panels) in livers of CV and GF mice exposed to corn oil, PCN, and TCPOBOP. Asterisks (*) represent statistically significant differences as compared with corn oil-exposed group of the same enterotype; pounds (#) represent statistically significant differences between CV and GF mice exposed to the same chemical (two-way ANOVA followed by Tukey’s post hoc test; statistical significance was considered at adjusted p-value < .05). (For interpretation of the references to colour in this figure legend, the reader is referred to the web version of this article.)

