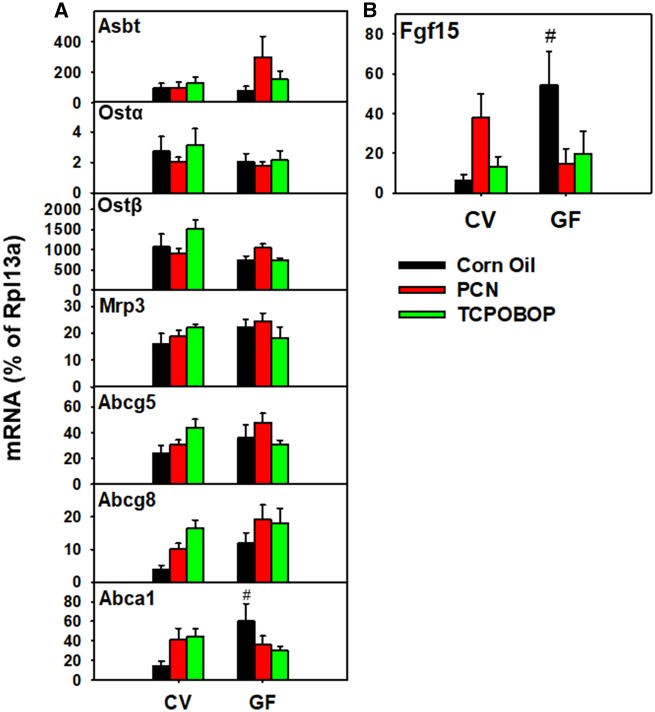
Figure 9.
RT-qPCR quantification of mRNAs of Cyp2c genes in liver of CV and GF mice exposed to corn oil, PCN, and TCPOBOP (n = 4–5 per group). The mRNA was calculated by dividing the ddCq for the gene of interest by the ddCq for the housekeeping gene Rpl13a. Asterisks (*) represent statistically significant differences as compared with corn oil-exposed group of the same enterotype; pounds (#) represent statistically significant differences between CV and GF mice exposed to the same chemical (two-way ANOVA followed by Tukey’s post hoc test with adjusted p-value < .05). (For interpretation of the references to colour in this figure legend, the reader is referred to the web version of this article.)

