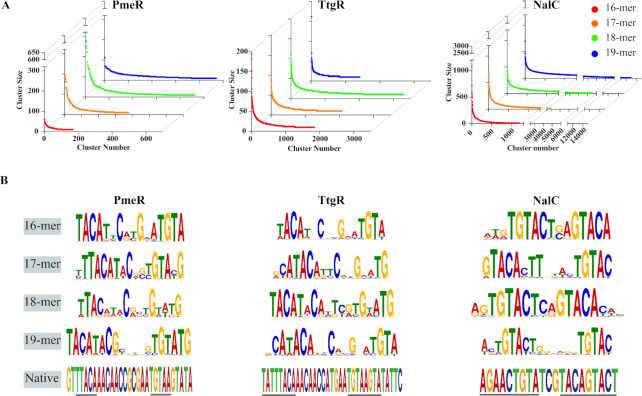
Figure 2.
In vitro selection of operators. (A) Highly similar operators are clustered together at 90% sequence identity threshold. Clusters ranked in descending order (left to right) by number of sequences within a cluster or cluster size (Y-axis). Cluster size shows characteristic exponential fit. Minimum number of sequences per cluster is five. Red, orange, green and blue represent operator libraries of length 16bp, 17bp, 18bp and 19bp, respectively. (B) Motifs of highly enriched sequences of all four operator libraries and native operator sites of PmeR, TtgR and NalC. Palindromic sequences representing putative half sites is underlined in native operator sites.

