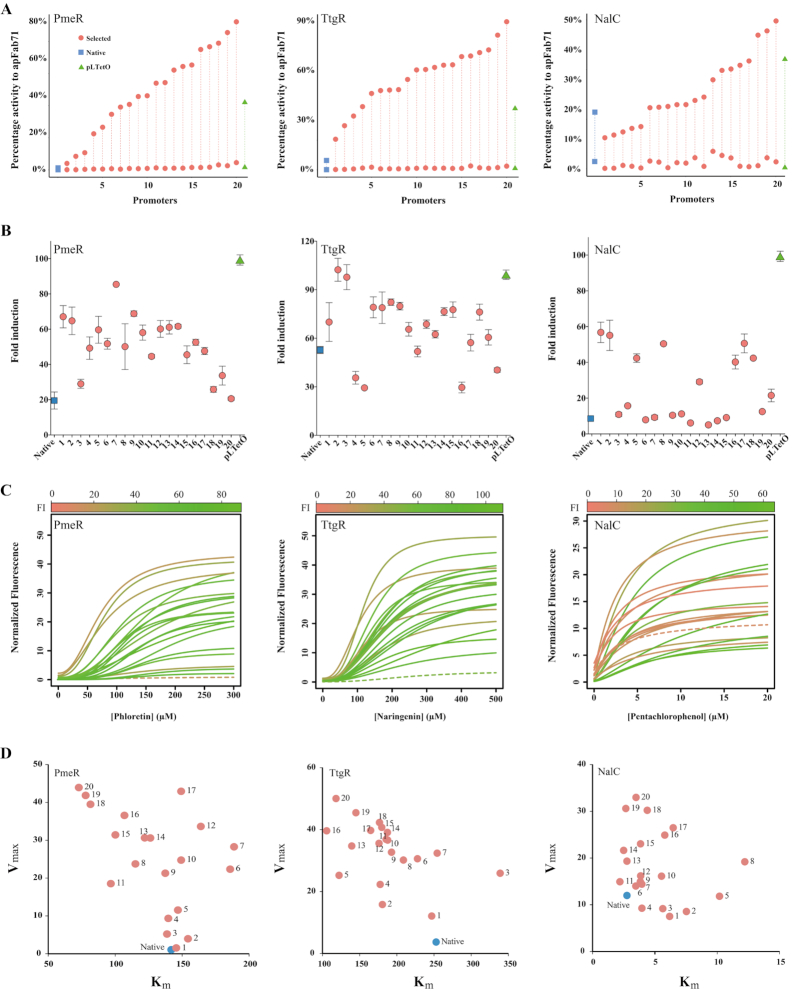
Figure 4.
Characterization of transcriptional activity of individual promoters. (A) Normalized fluorescence of uninduced and induced states (maroon circles) reported as a percentage activity of constitutive apFab71 promoter. Activity of native promoter ported into E. coli (blue squares) and commonly used pLTetO promoter (green triangles) are shown for comparison. (B) Fold induction ratio between induced and uninduced fluorescence of engineered, native and pLTetO promoters. (C) Ligand dose response data fitted to a standard Hill equation. Color gradient represents fold induction and native promoter is shown as dashed line. (D) Plot of maximum induced reporter expression (Vmax) versus concentration of ligand required to reach half Vmax (Km). Both parameters estimated from fitted Hill equation. Blue dot represents native promoter.

