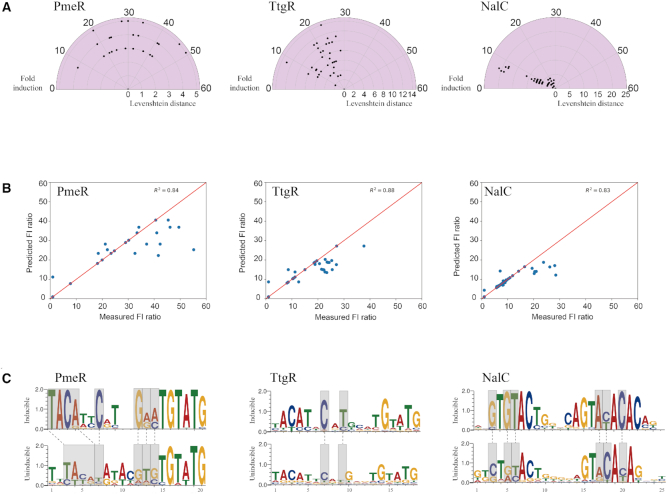
Figure 5.
Sequence determinants of promoter activity by machine learning. (A) Diversity of operator sequences and their corresponding fold induction shown as a speedometer plot. Central point corresponds to a reference sequence, in this case operator embedded with highest fold induction. Radial axis is Levenshtein distance between reference operator (center point) and the remaining inducible sequences. Angular axis is fold induction. (B) Scatter plots of fold induction predicted vs. experimental and the Spearman correlation coefficient. (C) Sequence motifs of inducible (top) and uninducible (bottom) operators. Y-axis represents bits. Gray boxes indicate differences in key sequence features between inducible and uninducible promoters. Logos were generated using web3logo tool

