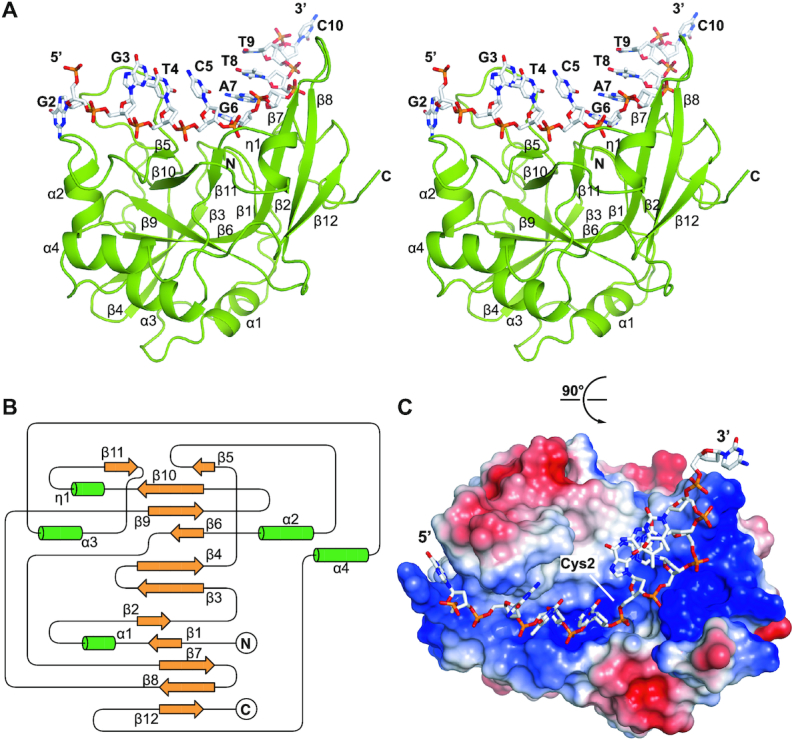
Figure 1.

The overall structure of yedK complexed with ssDNA. (A) Stereoview of the yedK–ssDNA complex structure. The yedK protein is shown in green and the ssDNA is shown in white with its atoms colored by element in PyMOL. (B) Topological diagram of the overall fold of the yedK protein. The β-strands and α-helices are shown in yellow and green, respectively. (C) Electrostatic surface representation of yedK and stick representation of the ssDNA. The protein surface is colored according to surface potential, with red and blue indicating negative and positive charges, respectively. The ssDNA is colored as in panel A.
