Figure 4.
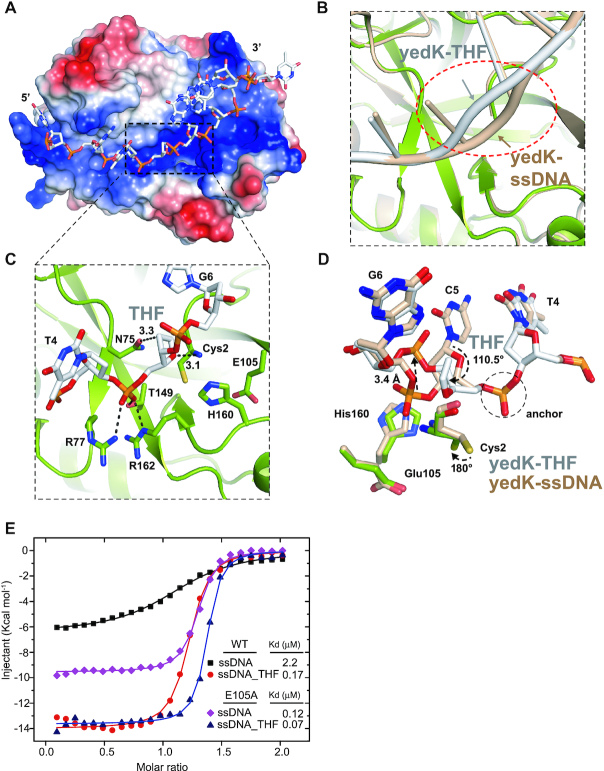
Structure and interactions between yedK and ssDNA containing a THF AP site. (A) Surface representation of the yedK–THF complex colored as in Figure 1C. The region around the THF AP site and catalytic site is indicated by a black dashed box. (B) ssDNA conformational changes between the yedK–THF and yedK–ssDNA structures. ssDNA strands are indicated by arrows. The structure of yedK–ssDNA is shown in wheat. yedK and ssDNA in the yedK–THF complex structure are shown in green and white, respectively. (C) The binding environment of the THF AP site. Contacts between the THF sugar moiety and the catalytic Cys2 residue of yedK are highlighted. ssDNA is shown in white and the environmental residues are shown in green. (D) Comparisons of the conformational changes between the ssDNA containing a THF AP site and native ssDNA. The phosphate group anchor is circled by a black dashed line, and the conformational changes are indicated by black arrows. The Cys2, Glu105 and His160 residues are also highlighted for comparison. (E) ITC results for yedK WT and E105A with the native ssDNA and ssDNA containing a THF AP site.

