Figure 2.
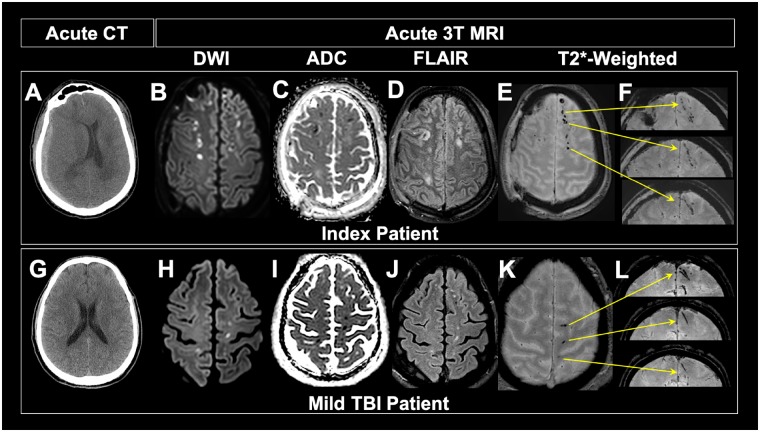
Imaging comparison of mild TBI patient and index patient. (A) Acute CT of index patient reveals subdural haemorrhage on patient’s right side, showing that the index patient was not of mild severity. (B–F) Acute 3 T MRI shows pattern of TMBs similar to that of mild TBI patient. (G) Acute CT of mild TBI patient in THINC study is unremarkable, showing no extra-axial blood or injury to the parenchyma. Hyperintensity viewed on diffusion-weighted imaging and corresponding hypointensity observed on apparent diffusion coefficient (ADC) of both index (B and C) and mild TBI patients (H and I) shows similar patterns of cytotoxic oedema in tissue surrounding TMBs. Pattern of hyperintense signal observed on FLAIR on both the index (D) and mild (J) TBI patients suggest acute vasogenic oedema around the same areas that we see TMBs. Punctate and curvilinear patterns of hypointensities observed on axial gradient recalled echo (GRE) images of index (E) and mild (K) TMBs have a linear shape on coronal view in both patients (F and L). Yellow arrows indicate exact location of each TMB in coronal view. Although not mild, the index patient has similar patterns of linear TMBs as observed in mild TBI patients.

