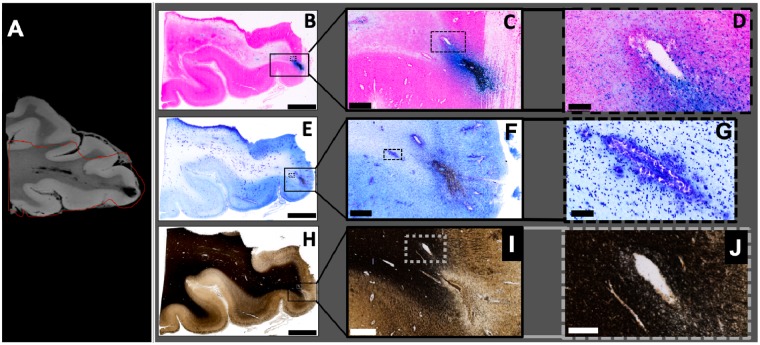
Figure 4.
MRI guided pathology shows evidence of injury to the vasculature. (A) 7 T small-bore 3D T2*-weighted MRI scan of region with visible TMBs within the index case. Red line indicates outline of the region that was included within the tissue block for 20-μm thick histology sections. (B–D) Perls Prussian Blue stain shows iron deposits in haemosiderin-laden macrophages. Solid line box (B) includes the grey-white matter junction and indicates the enlarged region shown in C. Dotted line box (C) indicates enlarged region in D showing cellular detail. (E–G) Nissl cytological stain. Solid line box (E) indicates enlarged region shown in F. Dotted line box (F) indicates enlarged region in G showing a linear pattern of high cell density. (H–J) Gallyas silver stain for myelin. Solid line box (H) indicates enlarged section shown in I. Grey dotted line box (H) shows grey-white matter border and indicates enlarged section in I. Within the white matter, myelin is absent from a linear region (I). In the adjacent area, myelin is slightly reduced (J) and cells with iron deposits are present (D). Scale bars in B, E and H = 3 mm; C and F = 500 μm; D and I = 100 μm; G = 50 μm; J = 30 μm.

