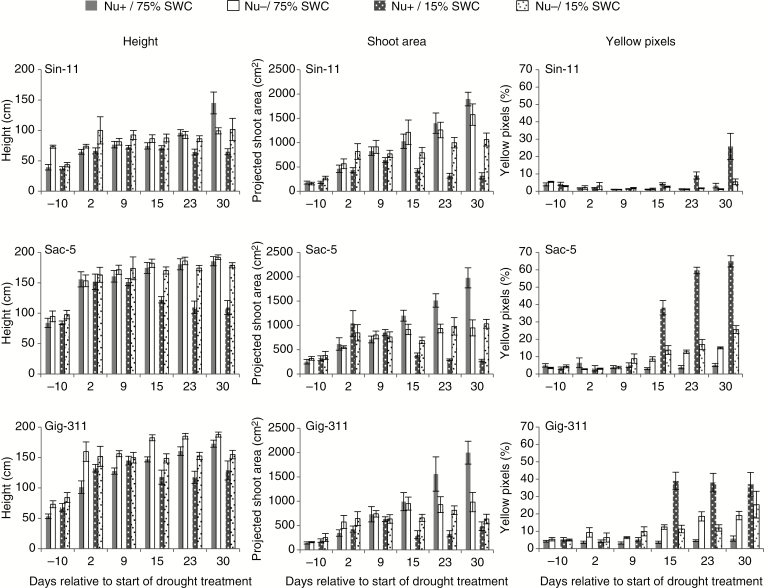
Fig. 3.
Height, shoot areas and percentage yellow pixels for each of the three miscanthus genotypes for each treatment (Nu+/75 % SWC; Nu−/75 % SWC; Nu+/15 % SWC; Nu−/15 % SWC) as extracted from RGB side images of the plants from 10 d before the start of drought treatment to 30 d after the start of the treatment. For each plant, images used for feature extraction were taken from two side-view angles with an interval of 90°. Data represent averages from six biological replicates for each genotype and treatment. Error bars indicate standard error.

