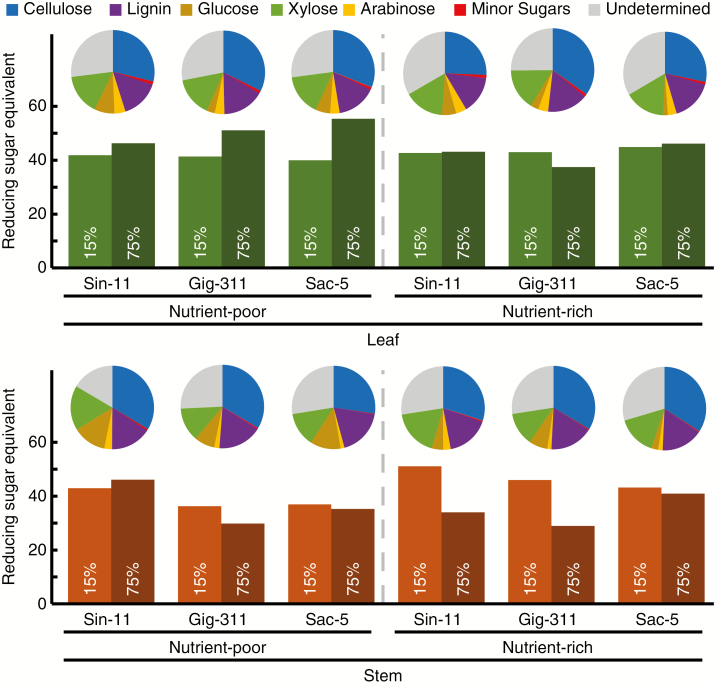
Fig. 5.
Comparison of the saccharification of lignocellulosic biomass from three miscanthus genotypes. Plants were grown in Nu+ and Nu− conditions and at 15 % or 75 % SWC. Saccharification was measured by colorimetric detection of reducing sugar equivalents, and is expressed as nmol of reducing sugars released per mg of dry biomass per hour after 8 h of saccharification. Pie charts indicate the relative (% DW) lignocellulosic biomass composition for leaf and stem of the three miscanthus genotypes grown at 75 % SWC under Nu+ or Nu− conditions. Minor sugars include fucose, galactose and rhamnose. See Tables 1–3 for further details.

