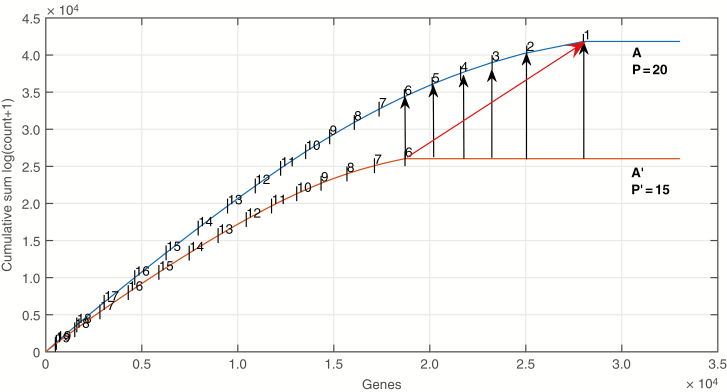
Fig. 2.
Illustration of the method for selecting parameter P for RoDEO for samples with very different sequencing depths. The smaller sample A′ is made comparable to the larger sample A by using P′ = P – 5 and adding 5 to the segment labels in A′. If no scaling was applied, the rightmost segment of A′ (having label 6 in the figure) would have label 1 and would be compared with the segment indicated by the red arrow in A (having label 1 in A). Instead, the segments 6, 5, 4, 3 and 1 in A are higher resolution sub-segments in A that are all represented by the segment 6 in A′. The genes are ordered from highest to lowest expressed on the x-axis, and the horizontal segments represent genes with zero reads.

