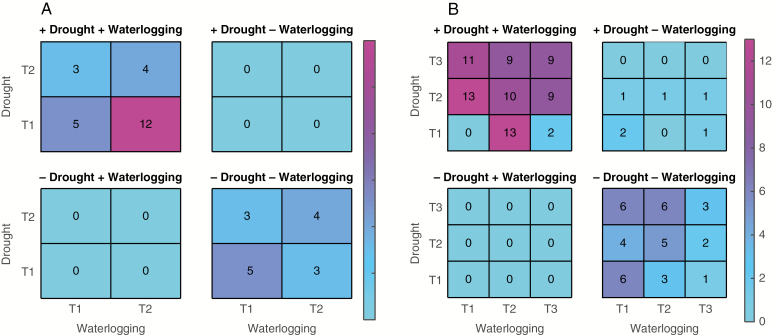
Fig. 5.
Overlaps of up- (+) and down- (–) regulated differentially expressed transcripts in each species and stress condition for those transcripts with a P-value ≤0.005, for cocksfoot (Dactylis glomerata) (A) and reed canary grass (Phalaris arundinacea) (B). Note that there are no transcripts that are up (+) in one stress and down (–) in the other for cocksfoot. For reed canary grass, there are few such transcripts up in drought and down in waterlogging. For cocksfoot, there are two time points measured (T1 and T2) while for reed canary grass there are three time points (T1, T2 and T3). For example, there are 12 transcripts upregulated in drought T1 and upregulated in waterlogging T2 in cocksfoot (dark pink square in the figure).

