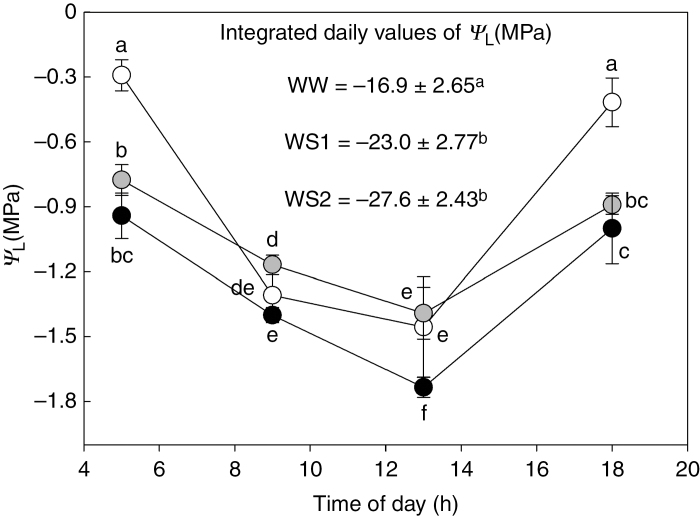
Fig. 2.
Daily trend of leaf water potential (ΨL) in Populus nigra plants subject to well-watered (WW, open circles), moderate water stress (WS1, grey circles) and severe water stress (WS2, black circles) conditions. In the box the integrated daily values of ΨL represent the cumulative difference in water potential from 0 MPa integrated over a 24-h period. Data (means ± s.d., n = 4) were subjected to one-way ANOVA; different letters indicate significant differences between groups at a significance level of P < 0.05 using Tukey’s test.

