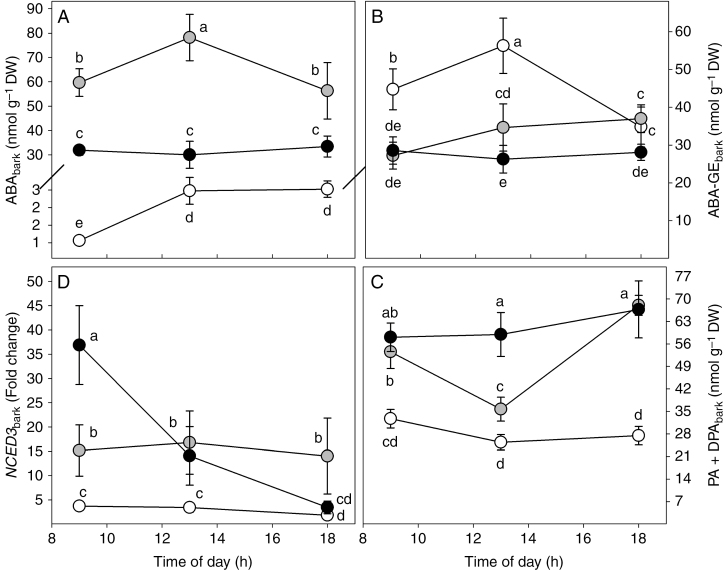
Fig. 5.
Daily trend of ABA (ABAbark, A), ABA-GE (ABA-GEbark, B), ABA catabolites (PA+DPAbark, C) and NCED3 expression (NCED3bark, D) in the bark of Populus nigra plants subject to well-watered (WW, open circles), moderate water stress (WS1, grey circles) and severe water stress (WS2, black circles) conditions. Data (means ± s.d., n = 4) were subjected to one-way ANOVA; different letters indicate significant differences between groups at a significance level of P < 0.05 using Tukey’s test.

