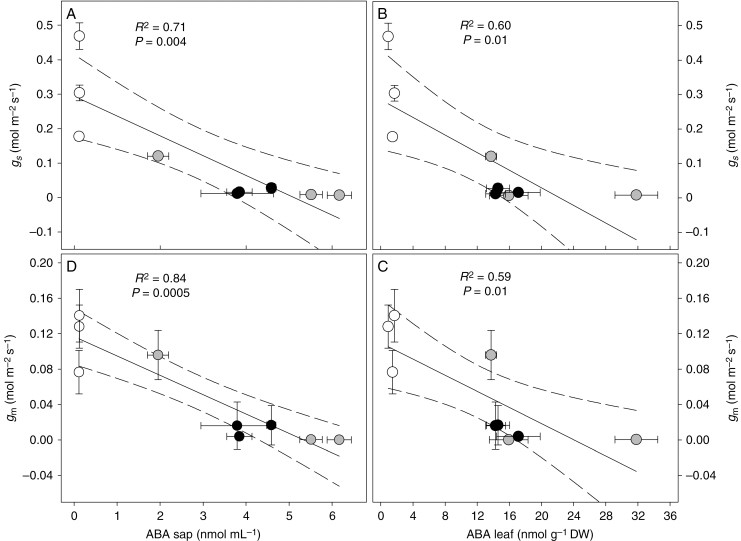
Fig. 8.
Relationships between ABA content in the xylem sap (A, B) and leaf (C, D) with stomatal conductance (gs) and mesophyll conductance (gm) in Populus nigra plants under well-watered (WW, open circles), moderate water stress (WS1, grey circles) and severe water stress (WS2, black circles) conditions measured in the morning (0900 h), midday (1300 h) and afternoon (1800 h) sampling points. P and R2 values indicate the results of linear regression. The central black line indicates the line of best fit. The dotted lines either side of the best-fit line indicate 95 % confidence intervals of the mean. Data are the means ± s.d. (n = 4).

