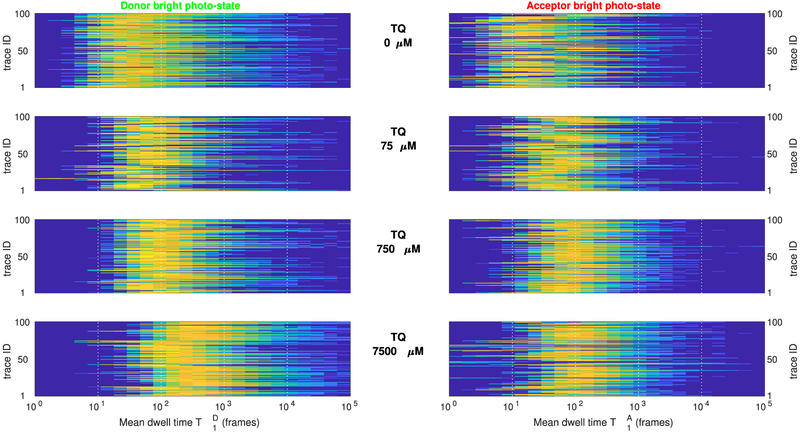
Figure 10.
Estimated donor and acceptor mean dwell times in the bright photostate from experimental data. Each panel summarizes the posterior probability distributions and (left and right, respectively), obtained from individual intensity traces and , for j = 1, …, 100, under increasing concentrations of the oxygen scavenger Trolox. For clarity, in all panels color encodes and while vertical axes are shown in logarithmic scale. As can be seen, despite the variability found between individual traces, estimated mean dwell times, from ≈102 frames at zero TQ, increase to ≈103 frames at 7500 μM Trolox, indicating an approximately 10-fold increase in the mean duration of the photobright periods for either fluorophore.

