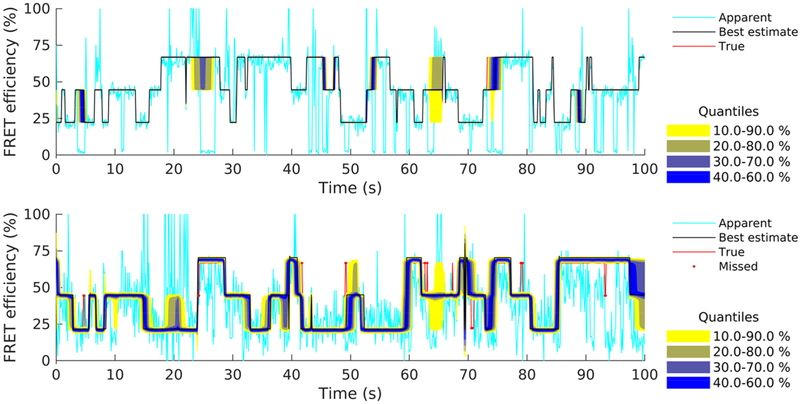
Figure 7.
Estimated FRET efficiencies from the intensity traces shown in Figure 4 (upper panel) and Figure 5 (lower panel). Estimates are summarized by posterior quantiles (color coded). To facilitate the comparison, we superimpose apparent FRET efficiencies (lighter line), best posterior estimate (black line), and ground truth values (red line). True efficiency values outside the 10–90% credible interval are also highlighted (red dots).

