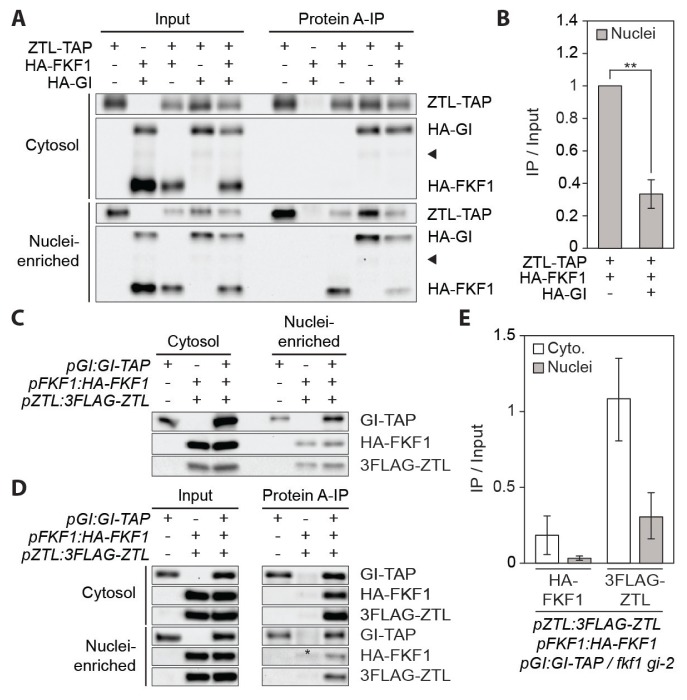
Fig. 2. GI inhibits the FKF1-ZTL interaction in the nucleus.
(A) In planta interactions among FKF1, GI, and ZTL proteins in the cytosolic and nuclei-enriched fractions. Proteins were transiently expressed in N. benthamiana for 3 days. FKF1 and GI proteins in the ZTL immune complex were probed with anti-HA and anti-protein A antibodies, respectively. Arrow heads indicate non-specific bands. (B) Relative amounts of the FKF1-ZTL complex with or without GI as shown in (A) were quantified. Bar graphs represent amounts of coimmunoprecipitated HA-FKF1, calculated by (HA-FKF1IP/ZTL-TAPIP)/(FKF1Input/ZTL-TAPInput). **P < 0.01 (one-tailed t-test). (C–E) The GI-FKF1 and GI-ZTL interactions in Arabidopsis. Ten-day-old pGI:GI-TAP / gi-2 #30, pZTL:3FLAG-ZTL pFKF1:HA-FKF1 / fkf1, and pZTL:3FLAG-ZTL pFKF1:HA-FKF1 pGI:GI-TAP / fkf1 gi-2 plants grown in long days were harvested at ZT13. Proteins were extracted and fractionated for coimmunoprecipitation. (C) Input proteins were loaded to compare relative protein levels between the cytosolic and nuclei-enriched fractions. (D) HA-FKF1 and 3FLAG-ZTL proteins in the GI-TAP immune complex. Long exposed immunoblot images for the nuclei-enriched fractions were used to visualize similar amounts of input proteins for comparing relative amounts of protein complexes between the cytosol and the nucleus. An asterisk denotes a non-specific band. (E) Quantification of the interactions of GI with FKF1 and ZTL in the cytosolic and nuclei-enriched fractions. Means ± SEM were calculated from three biological replicates.

