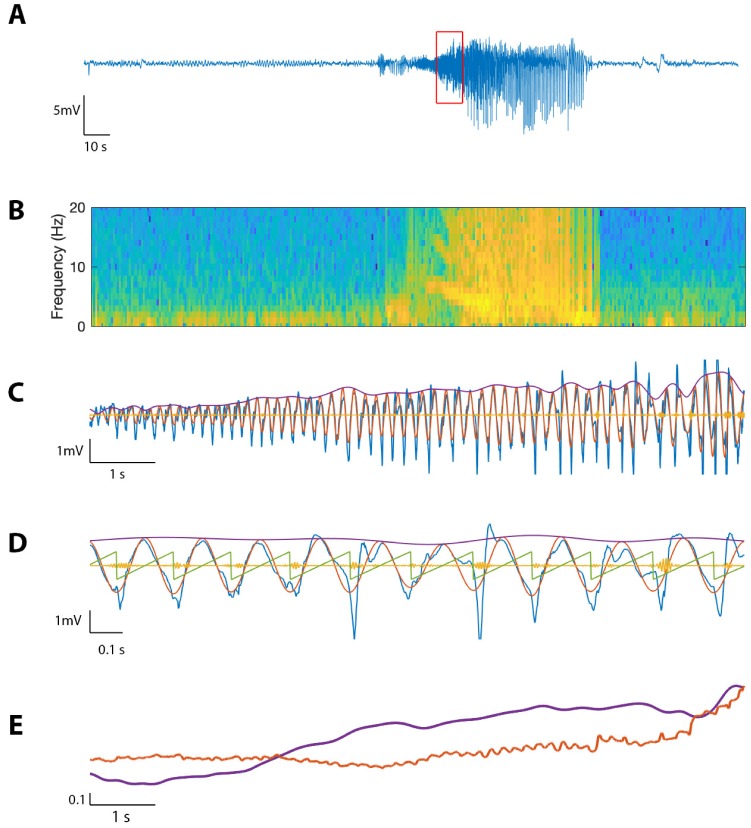
Figure 11. The proposed method detects cross-frequency coupling in an in vivo human recording.
(A,B) Voltage recording (A) and spectrogram (B) from one MEA electrode over the course of a seizure; PAC and AAC were computed for the time segment outlined in red. (C) The 10 s voltage trace (blue) corresponding to the outlined segment in (A), and (red), (yellow), and (purple). (D) A 2 s subinterval of the voltage trace (blue), (red), (yellow), (purple), and (green). (E) (purple) and (red) for the 10 s segment in (C), normalized and smoothed.

