
Fig. 2. M1 inactivation effects on movements gradually decline during long-term training.
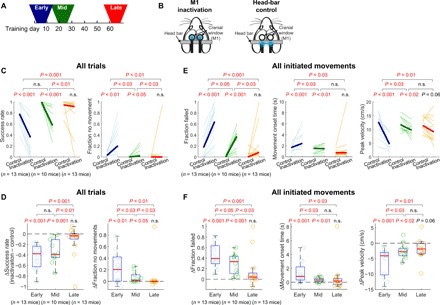
(A) Inactivation/head-bar control experiments in the early (days 1 to 9), mid (days 19 to 26), or late learning stage (days 61 to 69). (B) M1 inactivation and head-bar control days were randomly interleaved in each learning stage. The blue LED light was turned on in randomly selected trials (~12%) in each day. These light-on trials in the inactivation and head-bar days are referred to as inactivation and control trials, respectively, in the following comparisons. (C) The success rate and the fraction of trials in which mice made no movements out of all trials, in control versus inactivation trials, at the early, middle, and late learning stage. Thin lines represent individual mice, and thick lines represent medians across mice. Two-sided pairwise comparison between control and inactivation trials within each learning stage are displayed. For the effect size comparison between different learning stages, one-sided unpaired comparison was performed on the differences between control and inactivation trials in each stage. n.s., not significant. (D) Inactivation-induced changes (inactivation − control) in the success rate and the fraction of no movements out of all trials. The circles represent individual mice. The edges of the boxes mark the 25th and 75th percentiles, the whiskers extend to the most extreme nonoutlier data points, and the red lines indicate the medians across mice. The same statistical tests as in (C) are displayed. (E) Inactivation effects on trials in which mice initiated movements. The fraction of trials that mice initiated a movement but failed to reach the target, movement onset time, and peak velocity in control versus inactivation trials at the three learning stages. (F) Inactivation-induced changes in the fraction of failure, movement onset time, and peak velocity in all initiated movements.