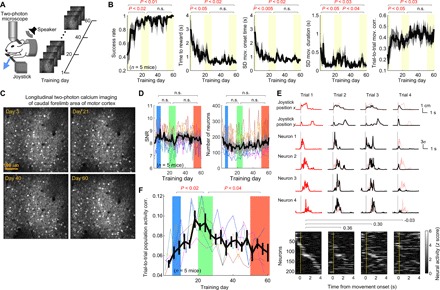
Fig. 4. M1 population activity consistency evolves in two phases over long-term training.

(A) Longitudinal imaging of the neurons in the same field in M1 over the course of 60-day training in the joystick task. (B) Task performance and movement consistency during the 60-day training in the imaging mice: the success rate, time required to acquire reward, variability of movement onset time, variability of movement duration, and trial-by-trial movement trajectory correlation as a function of training day, from left to right. Mean ± SEM (n = 5 mice). The three shaded regions correspond to days 1 to 3, 19 to 29, and 50 to 60, respectively. Two-sided pairwise comparison for each pair of learning stages is displayed. (C) The imaging fields from training days 3, 21, 40, and 60 of a single mouse. (D) The SNR and the number of neurons in the imaging field as a function of training day. Mean ± SEM (n = 5 mice). The blue, green, and red shaded regions correspond to the early, middle, and late learning stages in the inactivation experiments, respectively. (E) Movement trajectory, four single-neuron activity, and whole-population activity (heat map) from four example trials in a single day. The vertical lines mark movement onset. The trajectory and single neuron activity of trial 1 were superposed in the other trials as a thin red line for comparison. The neurons in the heat map are sorted in the same way in all four trials according to the peak activity time in trial 1. The three numbers above the heat maps indicate the trial-to-trial population activity correlation for the corresponding trial pairs. (F) The trial-to-trial population activity correlation as a function of training day (bin size: 3 days). Thin different colors represent different mice, and the black line represents mean ± SEM (n = 5 mice). The three shaded regions include bins corresponding to the three learning stages in (D). Two-sided pairwise comparison for each pair of learning stages is displayed.
