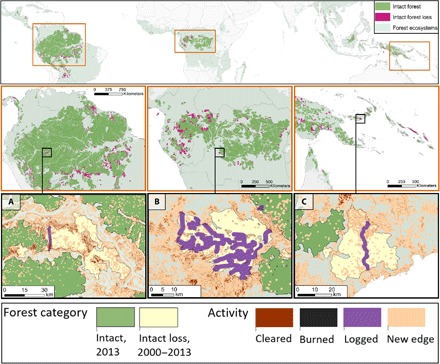
Fig. 1. Areas of tropical forest that remained intact in 2013 or were lost between 2000 and 2013 (2).

(A to C) Inset maps with orange borders show remnant and lost parcels of intact forest across Latin America, Central Africa, and Asia-Pacific. The second row of inset maps (black borders) shows the spatial distribution of activities that cause carbon emissions and forgo carbon removal in intact forest areas. Forest clearance and burned areas were sourced from (14) and (21), respectively. Selectively logged areas were simulated inside lost parcels by applying a 1-km buffer around roads mapped in the OpenStreetMap dataset (www.openstreetmap.org). New forest edges were simulated by applying 500-m buffers around footprints of burned area and forest clearance.
