
Fig. 3. Myeloid-Trib1 induces foam cell expansion.
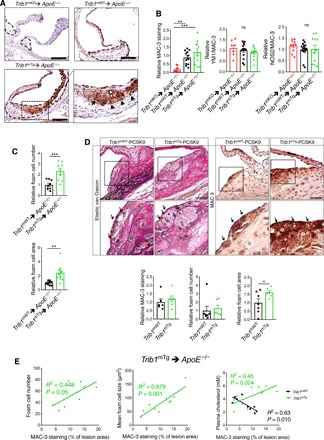
(A) MAC-3 staining (brown) of representative cross sections of the aortic sinus from specified mice (scale bars, 100 μm). Dashed lines indicate lesion boundaries. Arrows highlight foam cells in the boxed region (40-fold magnification). (B) Staining of aortic sinus lesions from specified chimeric mice with specified antibodies: MAC-3 (n = 9 to 12 per group) and double-positive YM1/MAC-3 (n = 7 to 14 per group) and NOS2/MAC-3 (n = 10 to 16 per group) cells. (C) Quantification of relative foam cell numbers (top) and size (bottom) in aortic sinus lesions of specified chimeras. n = 10 to 16 per group. (D) Representative images (scale bars, 30 μm) of Elastic van Gieson– and MAC-3–stained aortic sinus lesions from specified mice injected with rAAV/mPCSK9 (n = 9 to 11 per group). Arrows in magnified (×40) images of boxed area highlight foam cells. Quantification of MAC-3 staining and foam cell numbers and sizes (n = 6 to 7 per group). (E) Correlation between MAC-3 staining (x axis) in aortic sinus lesions of specified chimeric mice and foam cell numbers (left), foam cell size (middle), and plasma cholesterol levels (right). MAC-3 staining expressed as percentage (%) of total aortic sinus lesion area. R2, Pearson correlation coefficient. In (B) to (D), data (means ± SEM) are expressed relative to WT. Statistical differences were determined by one-way ANOVA (B) or Student’s t test (C and D). *P < 0.05, **P < 0.01, and ***P < 0.001.