
Fig. 5. Myeloid-Trib1 increases ORL1 expression, cholesterol uptake, and neutral lipid accumulation.
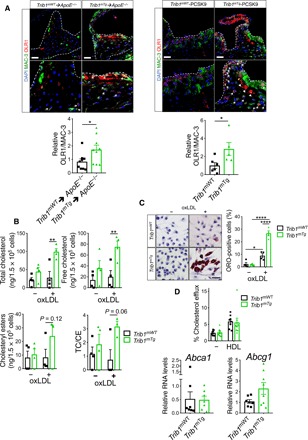
(A) Representative images (scale bars, 25 μm) of aortic sinus lesions from specified mice and enlarged images. Dashed lines indicate boundaries of lesions. MAC-3 (green), OLR1 (red), and nuclei counterstained with DAPI (blue). Arrows indicate OLR1-positive macrophages. Arrowheads indicate assumed acellular OLR1. Quantification: Trib1mWT➔ApoE−/− and Trib1mTg➔ApoE−/− chimeras, nine per group; mTrib1-PCSK9, five to six per group (mean ± SEM). (B) Intracellular total cholesterol, unesterified cholesterol, and cholesteryl ester contents of Trib1mTg and Trib1mWT bone marrow cells differentiated into macrophages and incubated with oxLDL (25 μg/ml) for 24 hours (n = 4 per group). (C) Representative images of BMDMs stained with Oil Red O (scale bar, 50 μm). Quantification was performed on three fields of view per sample. (D) Quantification of cholesterol efflux from cholesterol-loaded BMDMs to human HDL (n = 8 to 9 per group). RT-qPCR quantification of Abca1 and Abcg1 RNA in nonpolarized BMDMs prepared from specified mice (n = 7 to 8 per group). Data are means ± SEM. Significance determined by Student’s t test (A and D, bottom panels) or two-way ANOVA with Sidak’s multiple comparisons posttest (B to D) *P < 0.05, **P < 0.01, and ****P < 0.001.