
Fig. 1. Data-model precipitation, pCO2, and HTR trend through time.
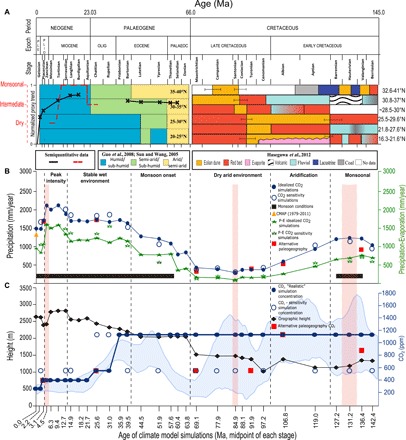
(A) Normalized quantitative precipitation proxy data trend (solid black line) is shown in conjunction with two qualitative proxy data compilations for the Cretaceous (31) and for the Paleogene and Neogene (4, 6) within 16°N to 41°N, 75°E to 130°E. Both colored panels in (A) are independent of either of the left y axis and indicate the intensity of the hydrologic cycle. The dashed red line (32) is a compilation of proxies from ocean drilling program sites 1146 and 1148 indicating monsoonal conditions. See the Supplementary Materials for details. (B) EA modeled mean annual precipitation (mm) for each geologic stage (region: fig. S4) at idealized CO2 (closed blue circle), sensitivity CO2 (open blue circle) concentrations, and alternative paleogeography (red square). The mean annual precipitation minus evaporation (mm) for each geologic stage at idealized CO2 (closed green star) and sensitivity CO2 (open green star) concentrations is shown. Black horizontal bar represents model-derived monsoonal conditions present. Orange triangle represents the mean annual (1979–2011) precipitation for the monsoon region from CMAP observations. (C) Mean orographic height (m) between 27.5°N and 45°N, 71.25°E and 101.25°E for each geologic stage (diamonds) and CO2 concentrations (circle/square) for each simulation. Shaded blue band signifies range in proxy CO2 uncertainty (3). Red vertical boxes (B and C) represent the three synthesized key periods investigated in this study. PALEAOC, Paleocene epoch; OLIG, Oligocene epoch; and PLE, Pleistocene epoch.