
Fig. 2. Atmosphere-ocean dynamics of three key periods.
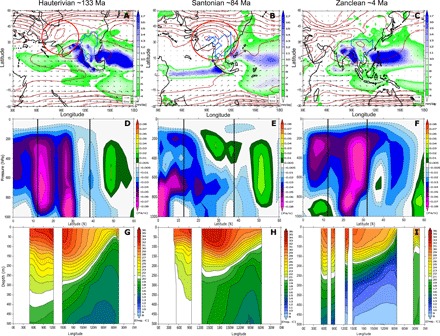
Wettest month 500-mbar geopotential height (isolines), wind field (black arrows), and precipitation in the Hauterivian (A), Santonian (B), and Zanclean (C) (paleo-rotated region in blue line). Wettest month zonal cross-sectional (0°N to 60°N, 105°E to 112.5°E) vertical velocity in the Hauterivian (D), Santonian (E), and Zanclean (F) depicting the position of the Hadley circulation; negative values indicate vertical ascent, positive values indicate vertical descent, and vertical black lines depict maximum and minimum latitudinal extent of rotated EAM region. Mean annual meridional (10°S to 10°N) depth profile ocean temperature (°C) for the Hauterivian (G), Santonian (H), and Zanclean (I) depicting the location of the Pacific warm pool. Red circles denote region of interest highlighted in the main text.