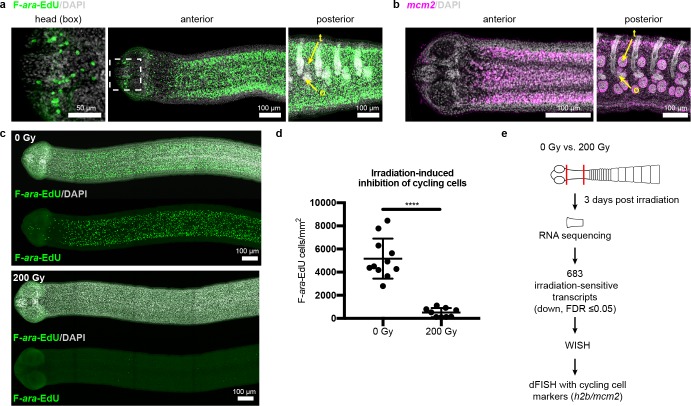
Figure 2. Cycling somatic cells are distributed throughout the tapeworm body and are irradiation sensitive.
(a-b) Maximum-intensity projections of confocal sections showing distribution of cycling cells by 2 hr uptake of F-ara-EdU (a) or FISH for mcm2 (b). Fewer cycling cells were found in the head (box), while abundant cycling cells were observed in both somatic and gonadal tissues throughout the body. t = testis, o = ovary. (c) Maximum-intensity projections of tile-stitched confocal sections after 1 hr uptake of F-ara-EdU (green) 3 days post-irradiation. (d) Quantification of F-ara-EdU+ cell inhibition from (c). Error bars = SD, N = 2, n = 11 and 9, Student’s t-test. (e) RNA-seq strategy to identify genes expressed in cycling cells. (Nuclei are counterstained with DAPI (gray) in this and all subsequent figures.).


