. 2019 Sep 24;8:e48958. doi: 10.7554/eLife.48958

Figure 3. Expression screening for cycling cell markers.

(a) Confocal section of a tapeworm anterior. Cycling cells (mcm2: magenta) in the neck parenchyma are between the nerve cords (cadherin: green). s: sucker, nc: nerve cord, oc: osmoregulatory canal, t: tegument, m: muscle, and p: parenchyma. (b) WISH of known cycling-cell markers h2b and mcm2. sc: scolex (head) and n: neck. (c) WISH for irradiation-sensitive transcripts expressed in the neck parenchyma. (d) Confocal sections of dFISH for irradiation-sensitive transcripts (green) with h2b or mcm2 (magenta) from neck parenchyma. Cyan arrowheads indicate cells magnified at the far right.

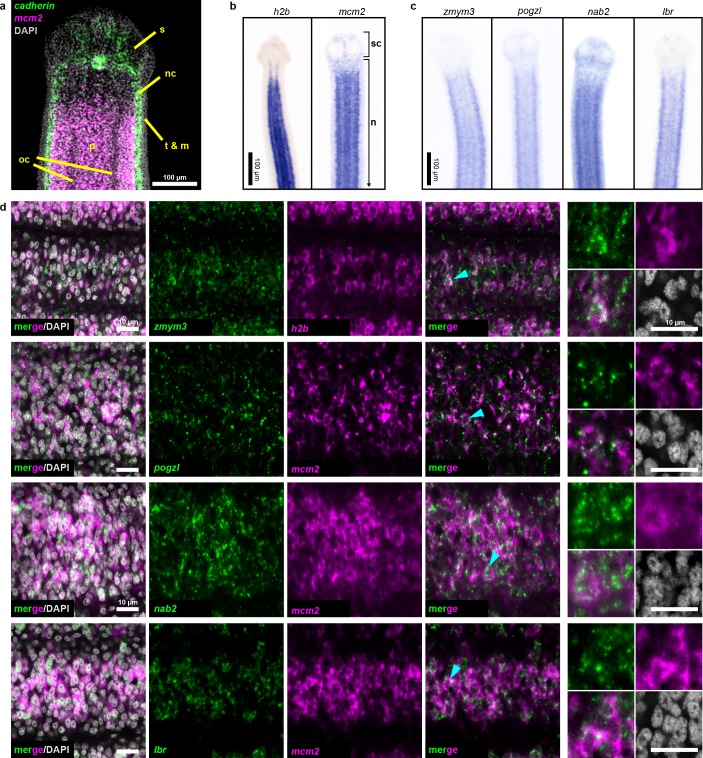
Figure 3.

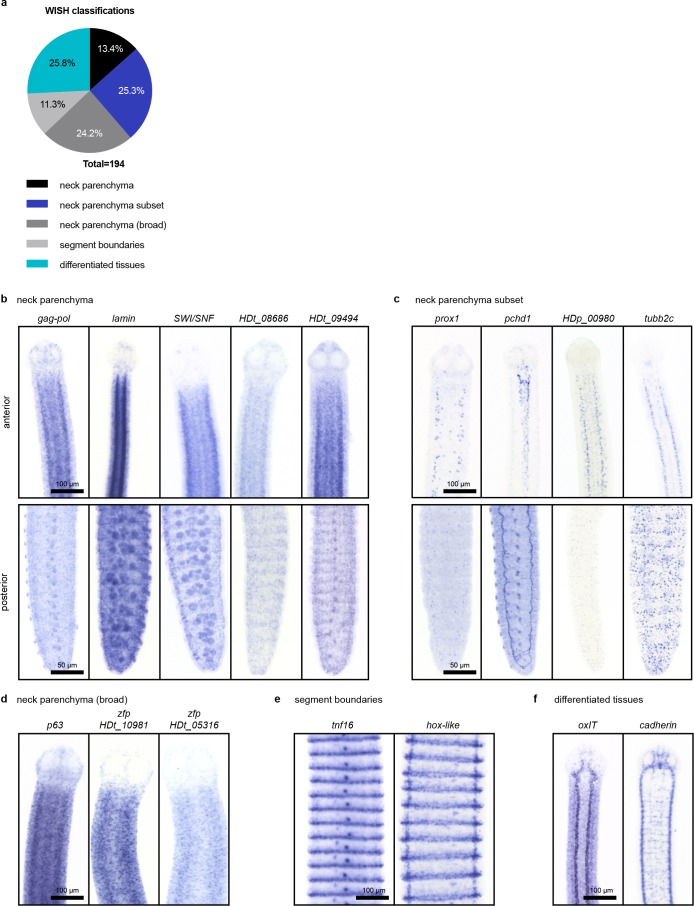
Figure 3—figure supplement 1. WISH patterns of irradiation-sensitive transcripts identified using RNA-seq.

Figure 3—figure supplement 1.

(a) Classification of WISH expression patterns of irradiation-sensitive transcripts. (b–f) Examples of transcripts expressed in the neck parenchyma (b) in subsets of cells within the neck (c) in neck parenchyma and broadly toward the animal edge where differentiated muscle and tegument are located (d) at segment boundaries (e) and in differentiated tissues (f) like the osmoregulatory canals (left) and nervous system (right).

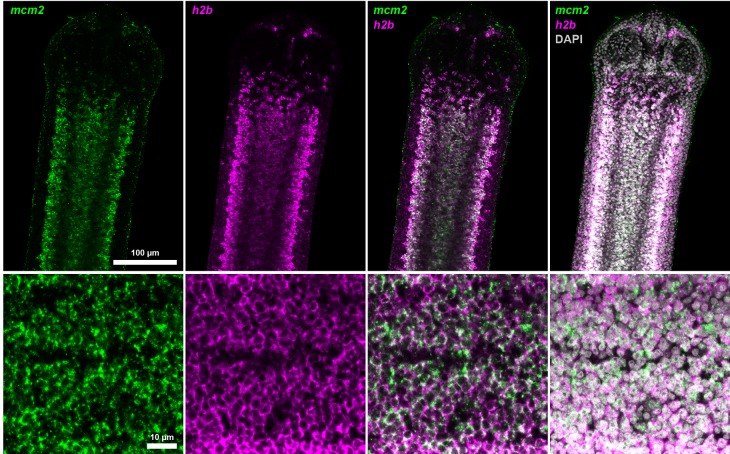
Figure 3—figure supplement 2. Coexpression of mcm2 and h2b.

Figure 3—figure supplement 2.

Confocal section of dFISH to detect mcm2 (green) and h2b (magenta) in the neck parenchyma at low (top) and high (bottom) magnification.

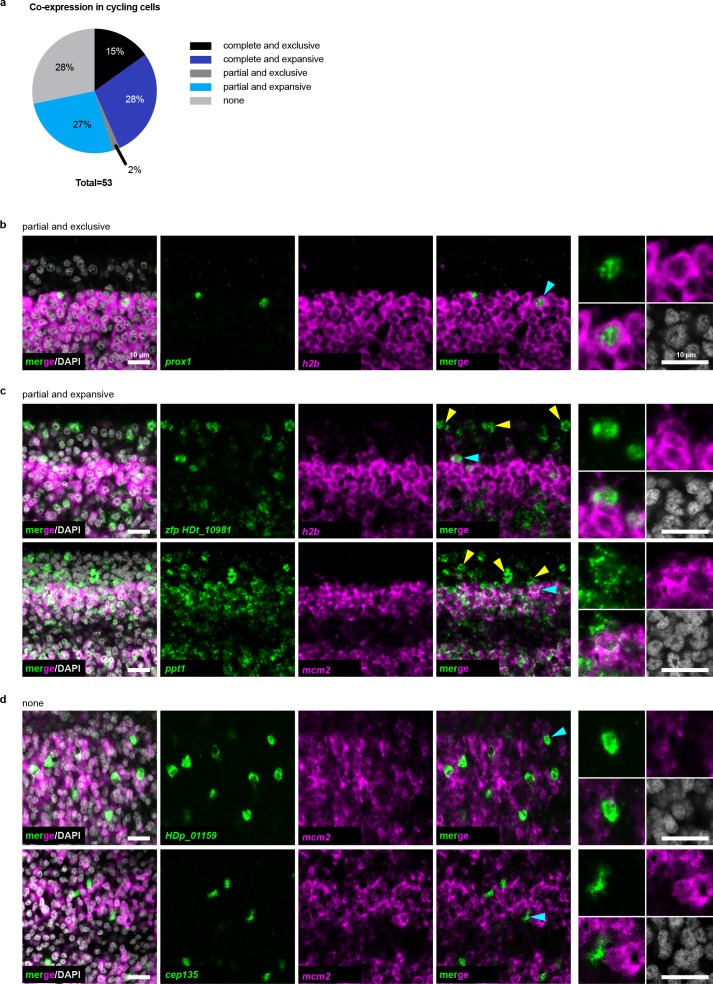
Figure 3—figure supplement 3. The cycling somatic cell population is heterogeneous.

Figure 3—figure supplement 3.

(a) Summary of different co-expression patterns obtained from 53 dFISH experiments. Also refer to Supplementary file 1b. (b–d) Confocal sections of dFISH to detect irradiation-sensitive transcripts (green) with h2b or mcm2 (magenta). Cyan arrowheads indicate cells magnified at the far right. For (c) yellow arrowheads point to examples of expression in non-cycling cells.