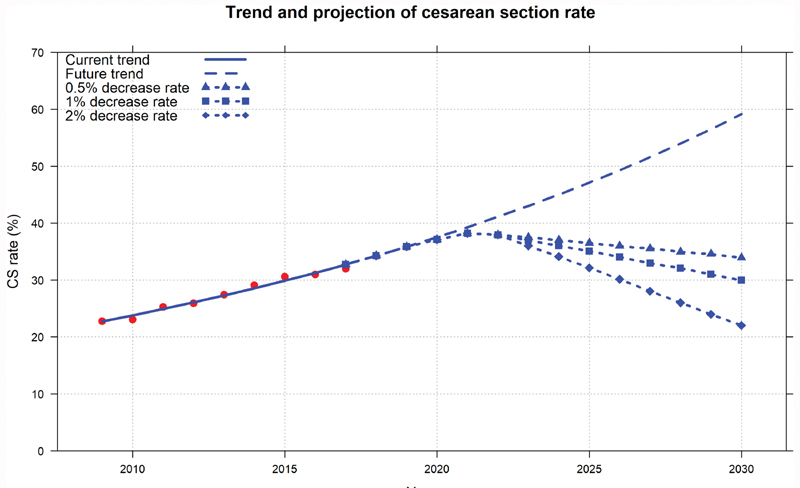
Fig. 1.

Projection of cesarean section rates (CSRs) from 2018 to 2030 by Joinpoint regression (CSRs 2009–2017—red dots; fitted and predicted line by regression—blue line; trend of CSR until 2030 projected using annual rates during 2009–2017—dashed line; and trend of CSR until 2030 projected using annual rates during 2009–2017 followed by decreasing annual rates after 2020 in different expected estimation: decreasing annual rate of 0.5%—triangle dashed line, decreasing annual rate of 1%—square dashed line, and decreasing annual rate of 2% – diamond dashed line).
