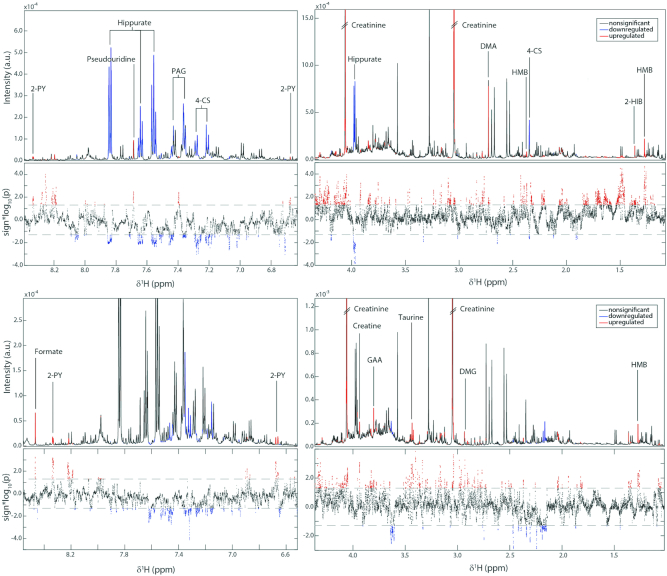
FIGURE 4.
Associations between the urinary metabolic profile and MTORC1 (upper panels) or VH (lower panels) based on the OPLS models. The NMR spectra are divided into 2 (right and left) to show the full range of δ1H. For each comparison the upper section of the panel shows the average 1H NMR spectrum (intensity in arbitrary units) and the lower section shows a Manhattan plot which displays the −log10(P value) for each of the spectral variables. Statistically significant peaks from the OPLS models are colored red if positively associated with MTORC1 or VH, and blue if inversely associated. n = 46 for both VH and MTORC1 models. For details of statistical analysis see the Methods. 2-HIB, 2-hydroxyisobutyrate; 2-PY, N-methyl-2-pyridone-5-carboxamide; 4-CS, 4-cresyl sulfate; DMA, dimethylamine, DMG, dimethylglycine; GAA, guanidinoacetic acid; HMB, β-hydroxy-β-methylbutyrate; MTORC1, mechanistic (or mammalian) target of rapamycin complex 1; PAG, phenylacetylglutamine; OPLS, orthogonal projection to latent structures; VH, villus height.

