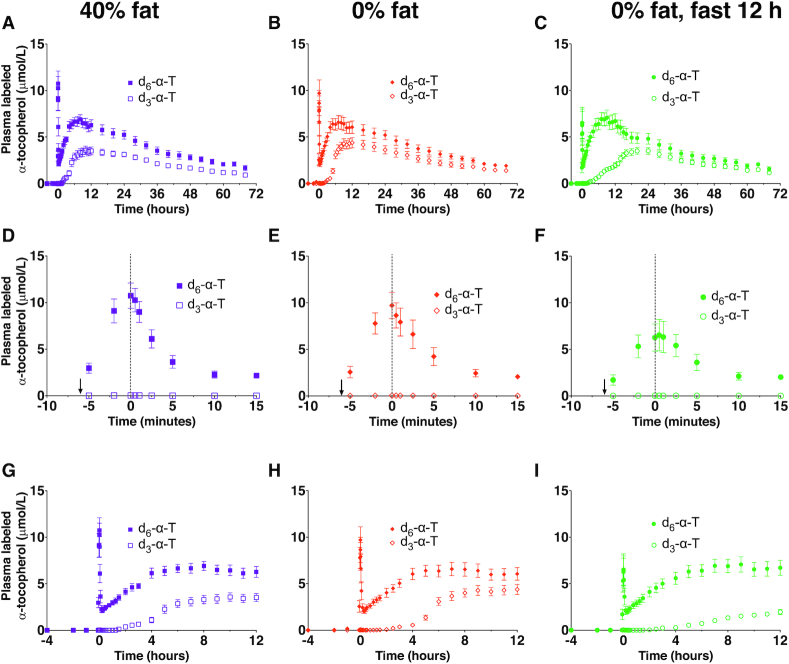
FIGURE 3.
Plasma d3- and d6-α-T concentrations following simultaneous administration of oral d3-α-T and intravenous (IV) d6-α-T. Plasma d3- and d6-α-T concentrations were measured in healthy adult women following α-T administration via 2 routes: slow IV injection of 30 mg (68.8 μmol) d6-α-T given in an oil–water emulsion and 30 mg (69.3 μmol) d3-α-T given orally with a defined liquid meal containing 40% fat (A, D, G), with 0% fat (B, E, H) or with 0% fat followed by a 12-h fast (C, F, I). Panels A–C, G–I show time in hours, while panels D–F show time in minutes; an arrow at –6 min shows the start of the IV infusion, and a dotted vertical line at 0 h indicates the end of the emulsion injection. Concentrations are shown as mean ± SEM (40% fat, n = 10; 0% fat, n = 10; 0% fat-fast, n = 7). Some subjects participated in multiple interventions (see Table 1 for participants’ allocation to interventions, and see Table 2 for statistical interpretation of differences).

