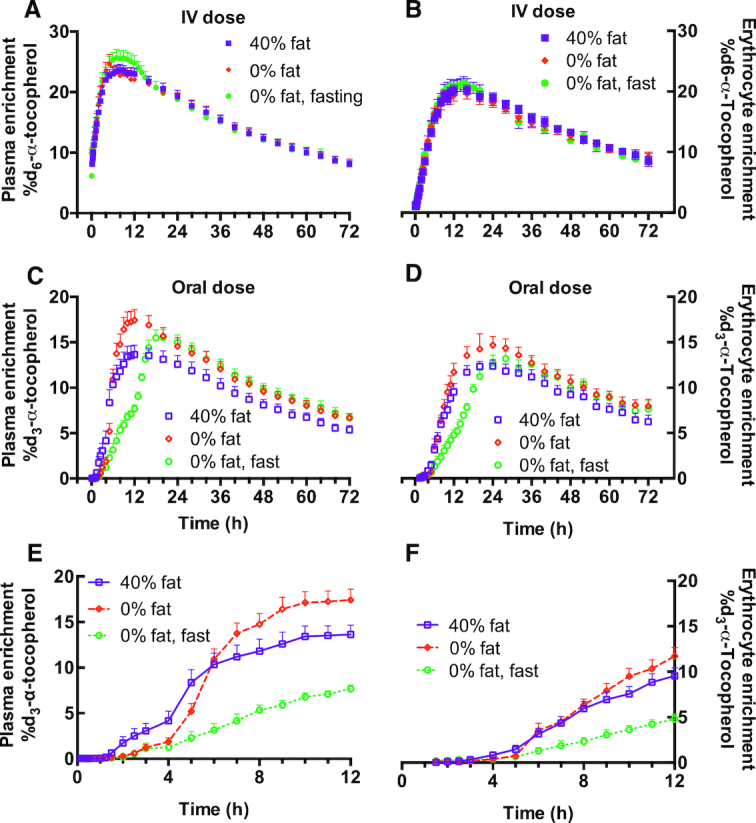
FIGURE 4.

Plasma and erythrocyte d3- and d6-α-T enrichment percentages following simultaneous administration of oral d3-α-T and intravenous (IV) d6-α-T. The enrichments were calculated (described in Subjects and Methods) from the area responses of d3- and d6-α-T measured by LC-MS/MS in plasma and RBC obtained from healthy adult women, as described in Figure 3. Plasma d6-α-T (A) or d3-α-T (C, E) enrichments or RBC d6-α-T (B) or d3-α-T (D, F) enrichments during the 40% fat, 0% fat, or 0% fat-fast interventions. Enrichments are shown as mean ± SEM (40% fat, n = 10; 0% fat, n = 10; 0% fat-fast, n = 7). Some subjects participated in multiple interventions (see Table 1 for participants’ allocation to interventions, and see Tables 3 and 4, respectively, for statistical interpretation of differences).
