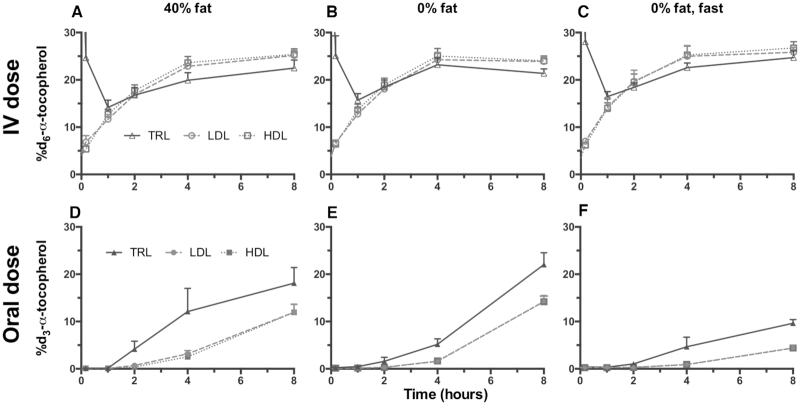
FIGURE 6.
Lipoprotein fractions following the intravenous (IV) and oral d-α-T dosing. The enrichments for the d6-α-T from the IV (A, B, C) and the d3-α-T from the oral (D, E, F) dosing of the lipoprotein density fractions: triglyceride-rich fraction [TRL (triangle), density (d < 1.006 g/mL)], LDL (circle, 1.006 < d > 1.063 g/mL), and HDL (square, 1.063 < d > 1.21 g/mL), isolated using discontinuous salt density-gradient ultracentrifugation, are shown (mean ± SEM). Statistical evaluations are given in Table 5.

