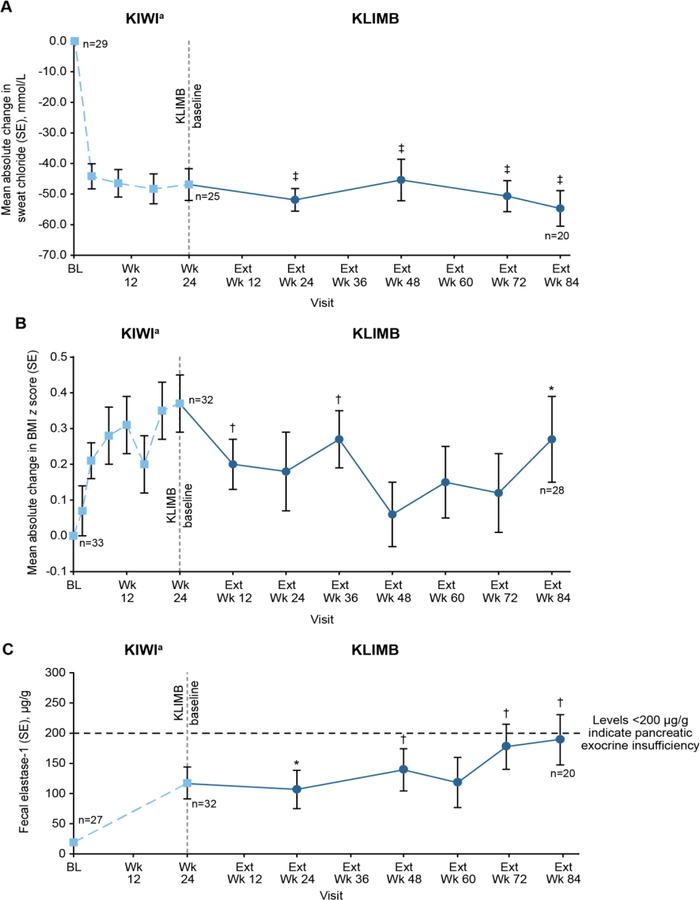
Figure 2.
Mean absolute change from KIWI baseline in (A) sweat chloride and (B) BMI z score and mean values for (C) fecal elastase-1 levels by visit. Means were calculated for each visit from the number of children contributing data at that time point. BL, baseline; Ext, extension; SE, standard error. aData shown for all children who enrolled in KLIMB. Data for intermediate visits from KIWI are not shown for fecal elastase-1. *P<0.05. †P<0.01. ‡P<0.0001. All P values are for absolute change from KIWI baseline.

