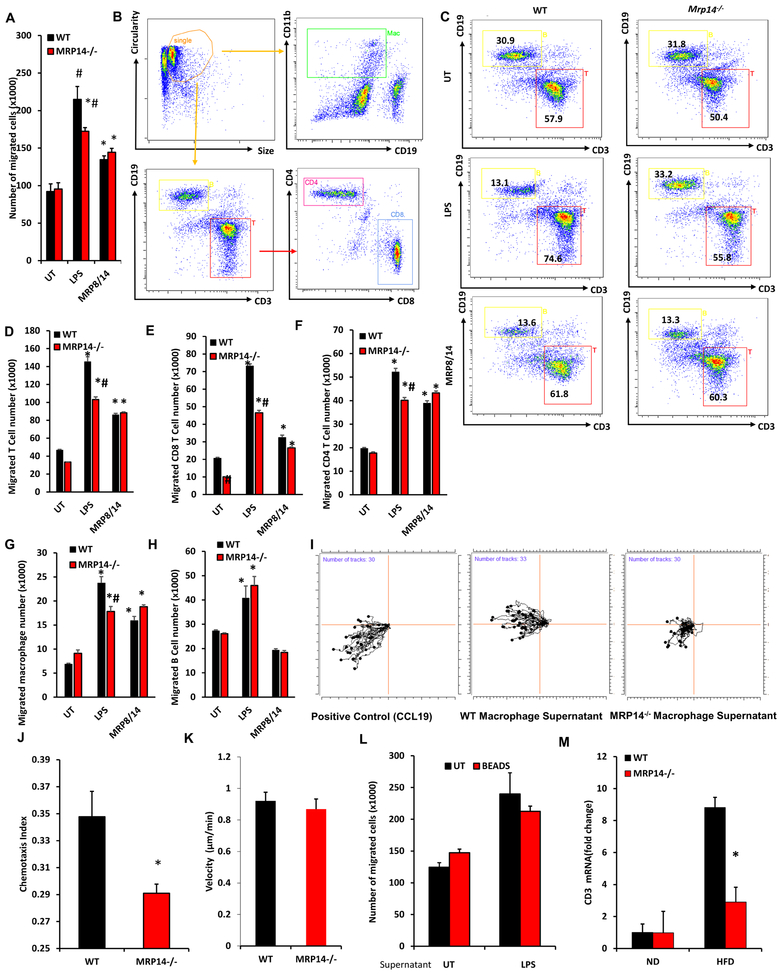
Figure 5. Effects of MRP14 on the ability of macrophage to recruit T cells.
A-H, BMDMs from WT and Mrp14−/− mice were treated with LPS (1 μg/ml, 24 hrs) or MRP8/14 heterodimer (3μg/mL, 24 hrs) and cell supernatant was collected for Transwell® assay. Leukocytes from the spleen of WT mice were placed in the insert of a 12-well Transwell® plate and the culture supernatant from treated WT and Mrp14−/− macrophages were placed in the bottom well. The total number of cells migrated into the bottom well was counted (A). The migrated cells were used for flow cytometric detection of different populations (B, gating strategy; C, representative dot plots showing T cell and B cell percentage) and the number of migrated T cells (D), CD8 T cells (E), CD4 T cells (F), CD11b+ CD19− macrophages (G), and CD19+ B cells (H) were calculated. I-K, iBIDI® Chemotaxis Assays. The same culture supernatants described in Figure 6A were also used for the iBIDI 3D Chemotaxis Assays representative plots (I), chemotaxis index (J), and migration velocity were shown. L, Protein G magnetic beads conjugated with anti-MRP14 antibody was used to deplete extracellular MRP8/14 in BMDMs supernatants. Culture supernatants with or without depletion of MRP14 were used for Transwell® assay. Depletion of MRP14 did not affect the migration, suggesting MRP14 does not directly induced cell migration. M, Expression of T cell marker Cd3e in the liver tissues of WT or Mrp14−/− mice was shown. *, p<0.05 compared with WT; #, p<0.05 compared with UT.

