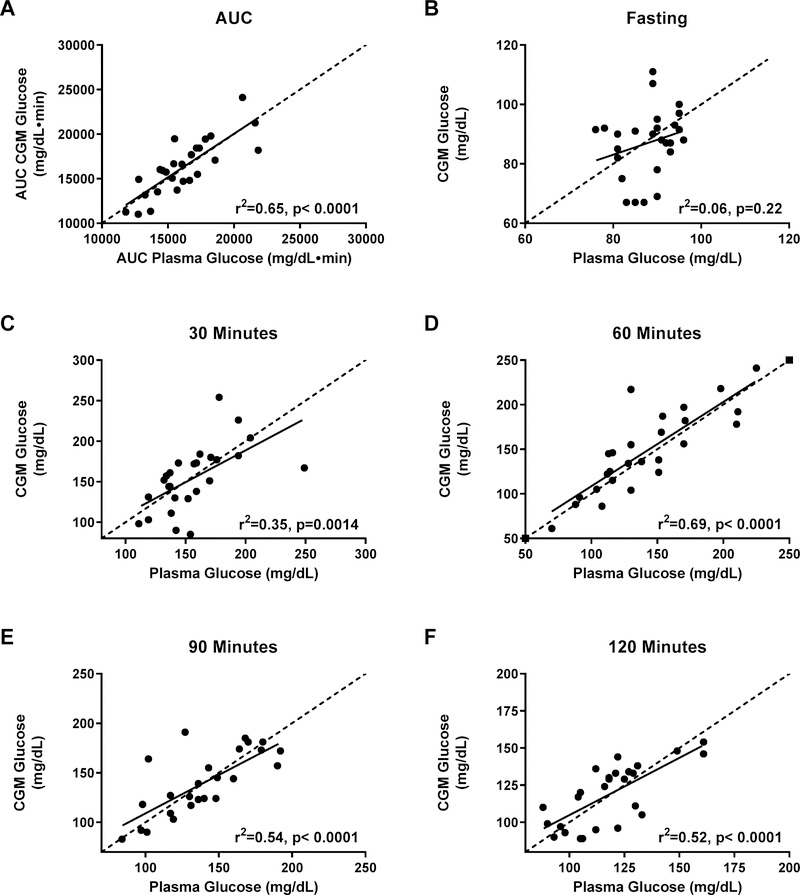
Figure 2.
Correlations (solid lines) between simultaneously-obtained plasma glucose and CGM glucose during an oral glucose tolerance test. (A) Glucose area under the curve (AUC); (B) fasting glucose; (C) time 30 minutes; (D) time 60 minutes; (E) time 90 minutes; (F) time 120 minutes of the glucose tolerance test. Dotted lines show the line of identity (slope =1, intercept=0).

