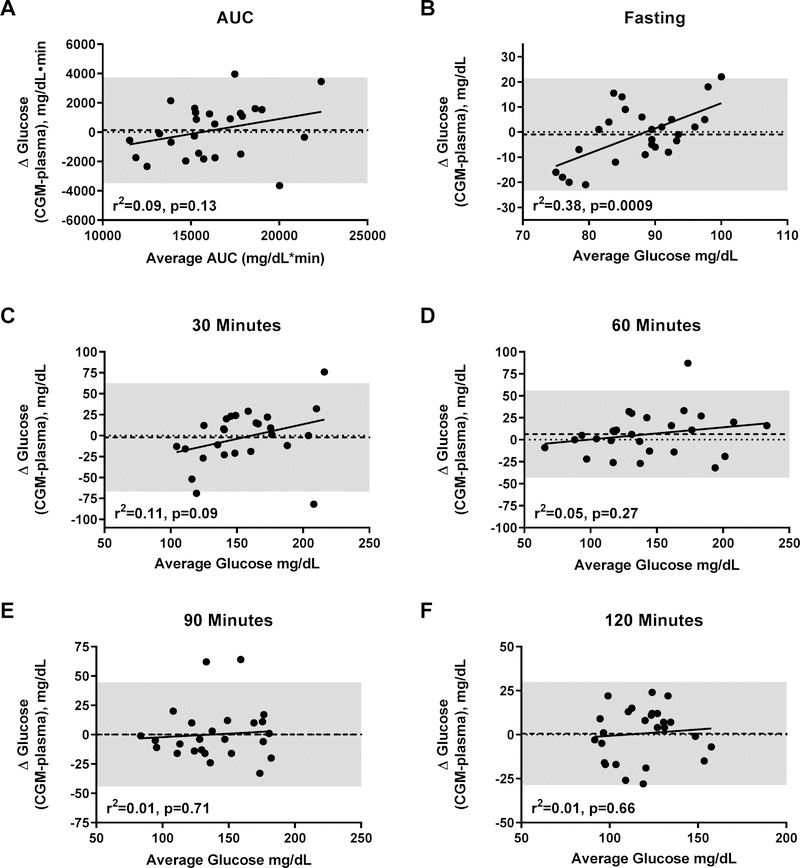
Figure 3.
Bland-Altman plots for systematic and magnitude bias in the measurement of glucose by CGM using plasma glucose as criterion method during an oral glucose tolerance test. (A) Area under the curve (AUC); (B); fasting glucose; (C) time 30 minutes; (D); time 60 minutes; (E); time 90 minutes; (F) time 120 minutes of the glucose tolerance test. Shaded area represents ±2 SD of mean difference. Linear regression lines (magnitude biases) are shown for each graph. The heavy dashed lines show mean difference between CGM and plasma glucose readings (systematic biases) and the shaded area indicates the limits of agreement. No significant systematic biases were found (all p’s>0.20).

