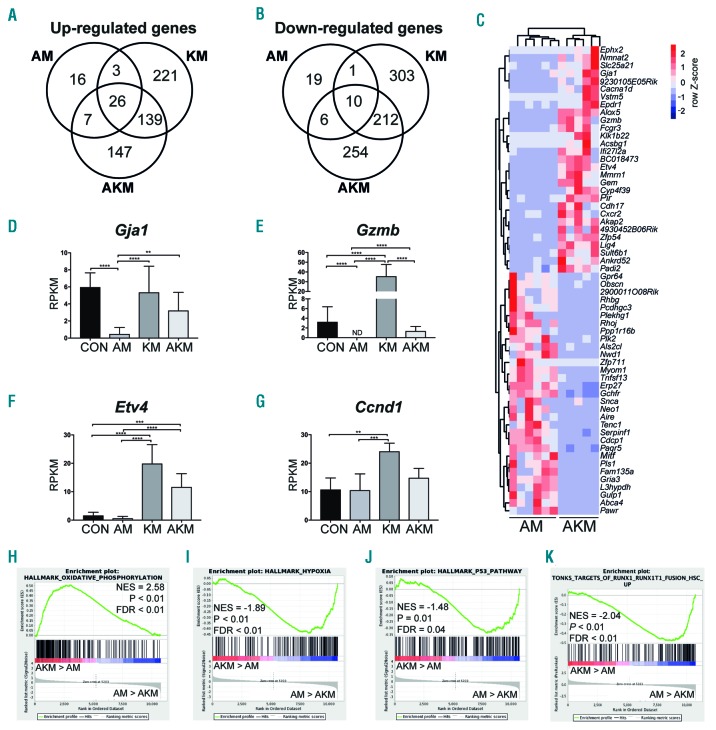
Figure 5.
RNA sequencing reveals distinct molecular signatures of hematopoietic stem cells (HSC) co-expressing Aml1-ETO and K-RasG12D. (A and B) Venn-diagram of significantly up-regulated (A) and down-regulated genes (B) in HSC identified by RNA sequencing. (C) Heatmap depicting the read per kilobase of transcript per million (RPKM) values of the top 30 significantly up-regulated and down-regulated genes in AKM HSC versus AM [false discovery rate (FDR) < 0.05]. (D-G) RPKM of selected genes identified from RNA sequencing, Gja1 (D), Gzmb (E), Etv4 (F), and Ccnd1 (G). RPKM and FDR were generated using edgeR package. The results are presented as mean±Standard Deviation. *P<0.05; **P<0.01; ***P<0.001; ****P<0.0001. (H-K) Gene set enrichment analysis (GSEA) of AKM versus AM HSC for oxidative phosphorylation (H), hypoxia (I), p53 pathway (J), and genes up-regulated in human HSC transduced with AML1-ETO (K). NES: normalized enrichment score.

