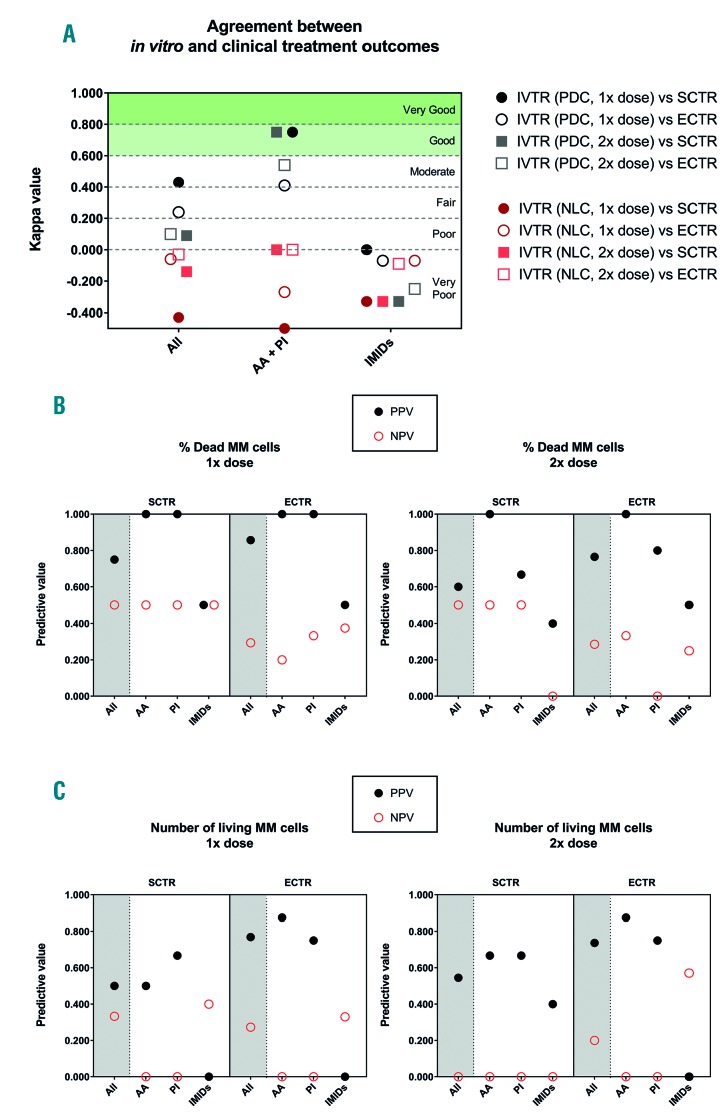
Figure 2.
κ and predictive values of the in vitro bone marrow multiple myeloma model for clinical treatment responses. The values depicted were analyzed for all treatments (all), or the treatments split into two groups: treatments with direct mechanisms of action (alkylating agents and proteasome inhibitors) and treatments with indirect mechanisms of action (immunomodulatory drugs). (A) κ values indicating the degree of agreement between in vitro treatment responses and clinical treatment responses (strict and extended). (B) The percentage of dead myeloma cells after treatment with a single (1x) or double (2x) dose was correlated to the strict and extended clinical treatment responses. The positive and negative predictive values were calculated for multiple comparisons. (C) Similar predictive values were calculated analyzing the number of live myeloma cells after treatment. AA: alkylating agents; PI: proteasome inhibitors; IMiDs: immunomodulatory drugs; IVTR: in vitro treatment responses; SCTR: strict clinical response, i.e., a clinical response immediately before or after bone marrow aspiration; ECTR: extended clinical treatment response, i.e., clinical responses ever recorded for that patient; PDC: percentage of dead myeloma cells after treatment, NLC: number of live myeloma cells after treatment; MM: multiple myeloma; PPV: positive predictive value; NPV: negative predictive value.

